See the previous chapter…
- Course overview: goals and introduction
- Positions: latitude, longitude, nautical mile, scale, knots
- Nautical chart: coordinates, positions, courses, chart symbols, projections
- Compass: variation, deviation, true • magnetic • compass courses
- Plotting and piloting: LOPs, (running) fix, dead reckoning, leeway, CTS, CTW, COG
- Advanced piloting: double angle on the bow • four point • special angle fix, distance of horizon, dipping range, vertical sextant angle, radians, estimation of distances
- Astronomical origin of tides: diurnal, semi-diurnal, syzygy, spring, neap, axial tilt Earth, apsidal • nodal precession, declination Moon and Sun, elliptical orbits, lunar nodes
- Tides: tidal height prediction, chart datums, tidal curves, secondary ports
- Tidal streams and currents: diamonds, Course to Steer, Estimated Position
- Aids to navigation: buoys, leading lights, ranges, characteristics, visibility
- Lights and shapes: vessels sailing, anchoring, towing, fishing, NUC, RAM, dredging
8 – Tidal streams and currents
Definition and origins of currents
Currents reflect the horizontal movement of water whereas tides, in the strictest sense, only reflect vertical movements. These currents influence the ship's position and are therefore important to understand.
The horizontal movement is primarily caused by the gravitational pull of celestial bodies, see Chapter 6 on the astronomical origins of tidesChapter 6 on the astronomical origins of tides. But also other factors are in play:
- Differences in water temperatures caused by heating and cooling due to the Earth's atmosphere.
- Differences in salinity caused by rain, evaporation and estuaries.
- Wind induced friction.
- The Coriolis force which is a consequence of the Earth's rotation.
Ocean surface currents

Prominent features in the map, see Figure 8.1 of the major ocean surface currents include the subtropical gyres centered on 30 degrees latitude in each of the major ocean basins.
The Earth's rotation – the source of the Coriolis force as mentioned above – and the change in wind direction with latitude (from the east in the tropics and from the west at mid-latitudes) cause the circulation of the gyres to
be clockwise ↻ in the northern Hemisphere and counterclockwise ↺ in the southern Hemisphere.
The well-known Gulf Stream in the Atlantic and its counterpart in the Pacific, the Kuroshio Current, are strong surface currents (e.g. 30 NM wide, 500 m deep, and with a velocity over 4 knots) that carry heat northward from the tropics.
The deep ocean currents (not shown) are caused primarily by water density differences and in general return the (now colder) water back towards the tropics.
To predict the behavior of major ocean currents several references are available. The Sailing Directions (also see this list of Planning guides) contain some information on normal locations and strengths of ocean currents.
Nevertheless, the Pilot Charts are by far the best reference for predicting the direction and speed of these currents. On these charts, arrows indicate the direction of the prevailing current; a number printed above the arrow indicates the average speed.
Since this information is based upon historical averages, it won't predict the actual ocean current encountered with 100% accuracy.
Coastal currents
Ocean surface currents need not be considered in coastal areas.
When close to the continental shelf, the horizontal movement of water is defined mainly by two terms:
- Tidal stream or tidal current: gravitational
- Current: gravitational, rivers, wind, thermohaline (temperature / salt) imbalances, but mind the conflicting definitions between UK, USA and other English speaking nations…
Tidal streams are described by drift / rate for its speed and set for its direction or bearing.
In order to address tidal streams you will need to use tide tables in conjunction with a tidal atlas, or the tidal diamonds found on the nautical chart.
Tidal atlases
An atlas is a collection of maps or charts, and is named after the Ancient Greek mythological figure Ἄτλας “Bearer (of the Heavens)”, and a tidal atlas presents tidal stream information in the form of 12 or 13 chartlets, one for each hour of the tidal cycle.

There is a chartlet for each hour of the tidal cycle (i.e. a successive high and low tide).
This chartlet features the tidal streams 4 hours before HW Brest; "avant" means before in french, and PM is the abbreviation for “pleine mer” AKA “marée haute”, french for high water and high tide.
The arrows indicate the direction (set) of the tidal stream, and their length and thickness give an impression of its rate.
More accuracy is given by the numbers, arranged in pairs, that show the rate in tenths of knots at neap and spring tides.
For instance 37 , 52 or 37 · 52 or simply 3752 gives a neap tide of 3.7 knots and a spring tide of 5.2 knots. When not placed around an arrow, the period (or comma) indicates the geographical position to which the figures refer.
To interpolate for tides that are between neap and spring either the
Rule of sevenRule of seven or an interpolation chart enclosed in the atlas is used.
Furthermore, dangerous areas are shown:
- Larger areas affected by overfalls, races or tide rips are highlighted by colour or contour lines.
- Specific positions by
 .
.
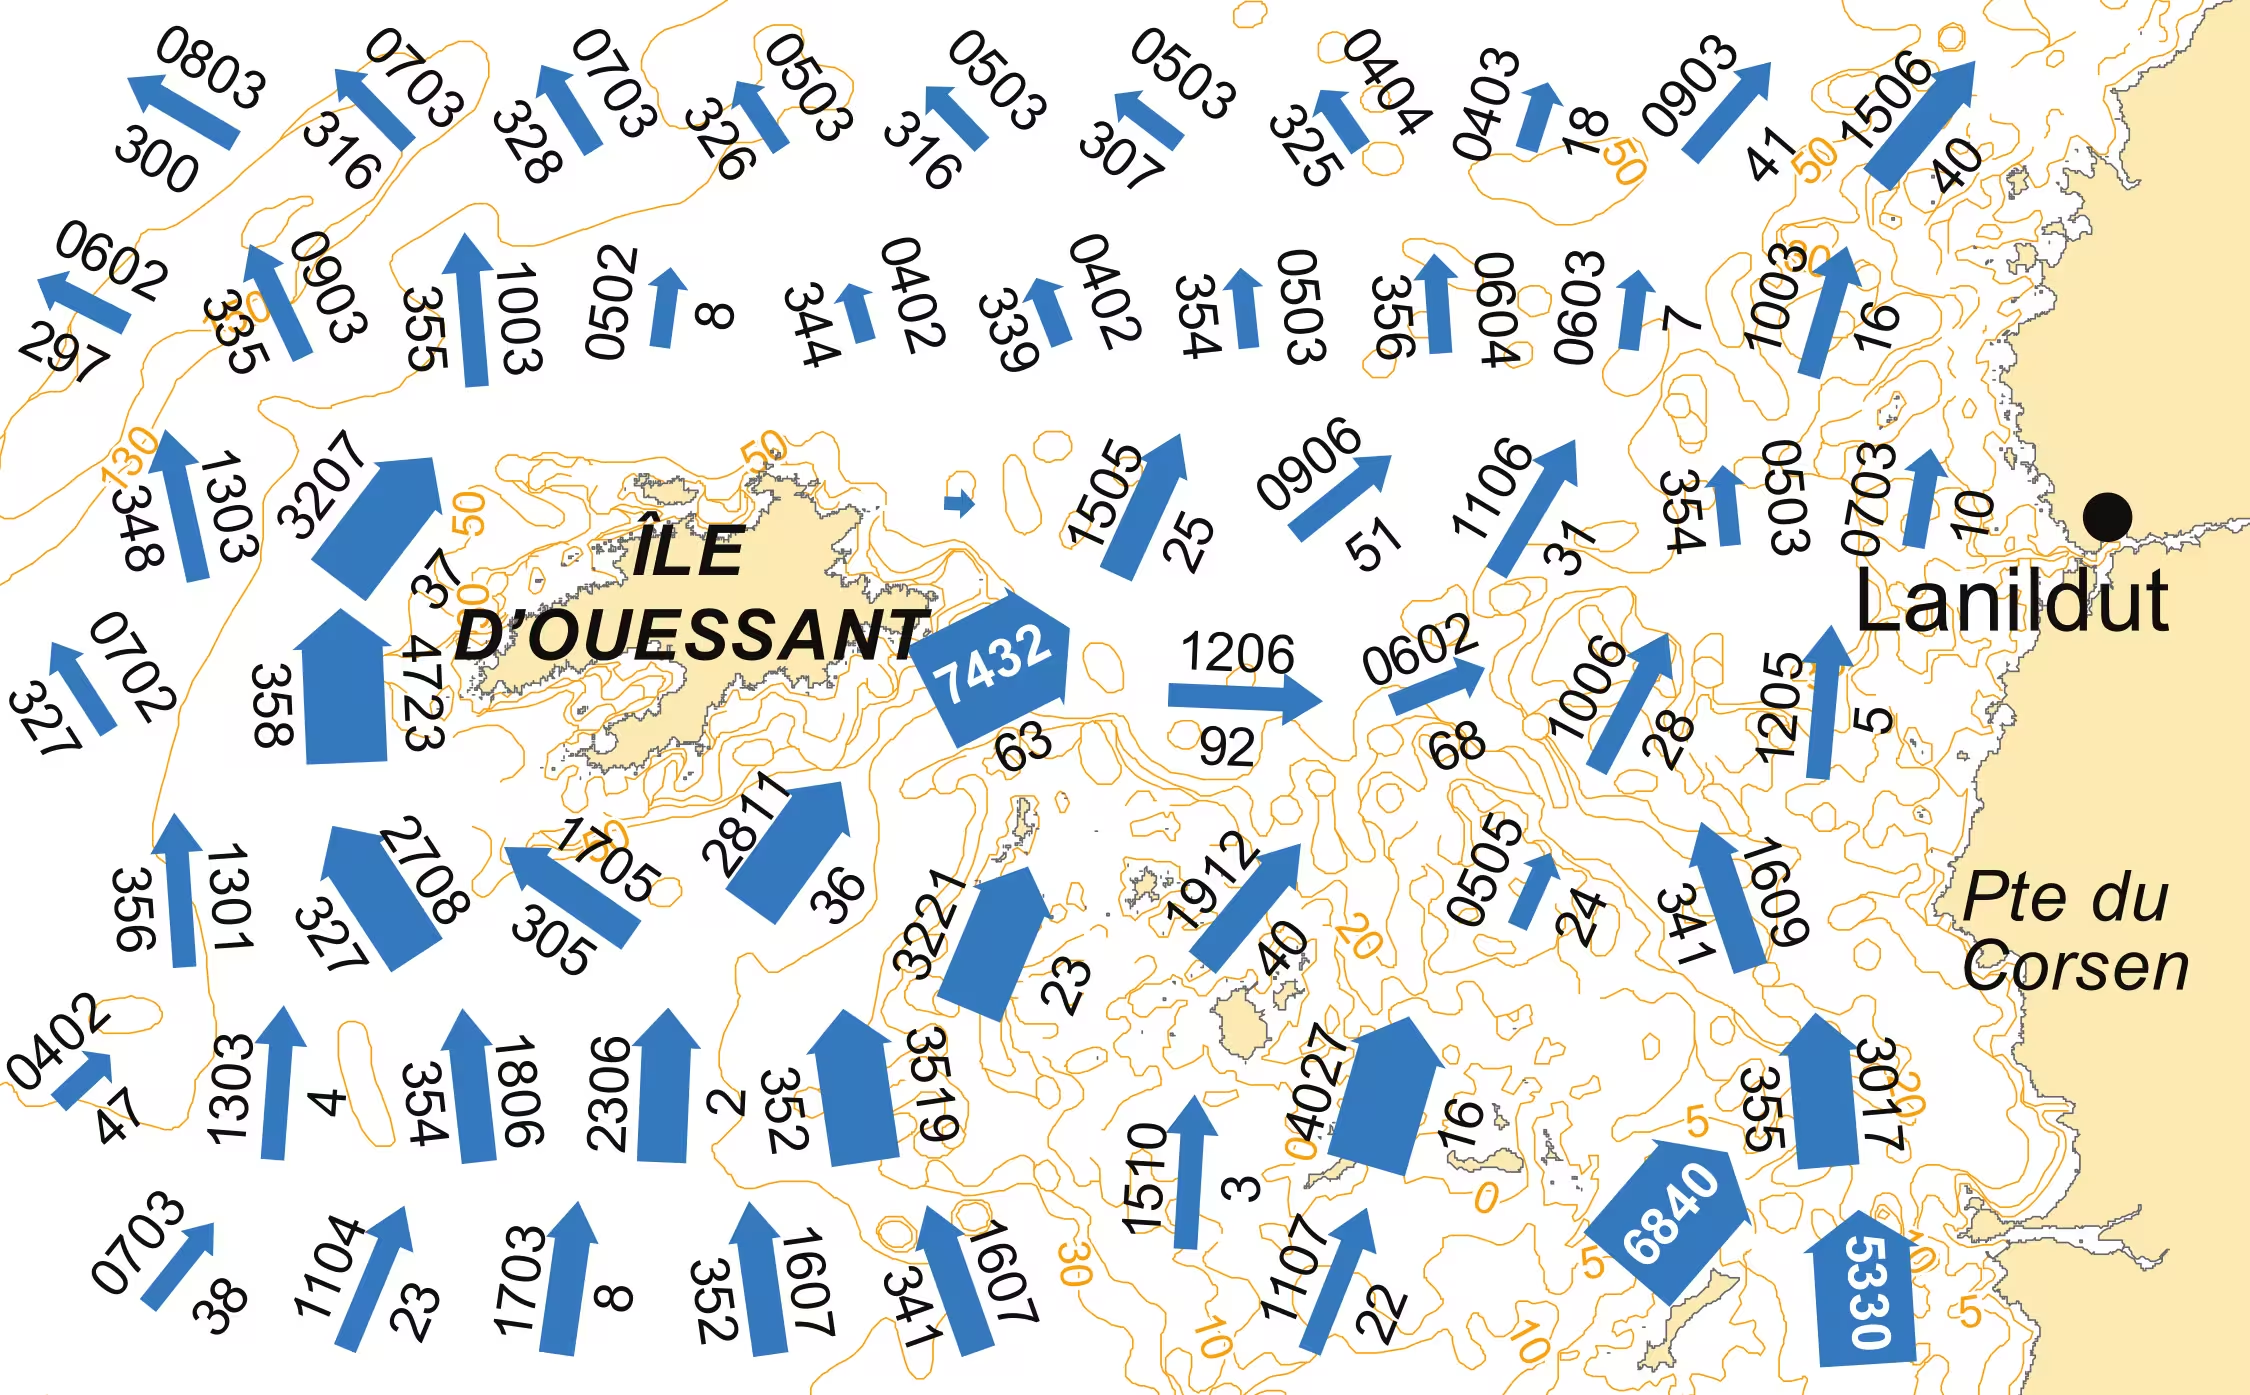
The shorter numbers near the arrows provide the direction of the flow: 0° to 359°.
Though several layouts can be used, usually the direction of the tidal stream is shown by arrows, which are heavier where the tidal streams are stronger. Figures against the arrows give the mean neap and spring
drift or rate in tenths of knots.
For example, ![]() indicates a mean neap drift of 2.1 knots and a mean spring drift of 4.6 knots.
indicates a mean neap drift of 2.1 knots and a mean spring drift of 4.6 knots.
A short thin arrow shows a weak tidal stream; a fatter and usually longer one shows a faster one.
Tidal atlases provide not only a graphical version but also show a wider area, and are therefore a very useful addition to tidal stream diamonds.
Tidal apps are to be used alongside the paper publications as well as the tidal layers of the chart plotter. The online and electronic versions will often allow animations and selecting a specific arrow will usually show set and rate, with the precision of a tidal diamond.
Diamonds: tidal stream data in the chart
An alternative to a tidal atlas is a tidal diamond, which are often less accurate and less easy to use, yet more readily available.
![]() Tidal diamonds are symbols on the nautical chart that indicate the direction (bearing) and speed of tidal streams, consisting of a capital letter inside a rhombus
Tidal diamonds are symbols on the nautical chart that indicate the direction (bearing) and speed of tidal streams, consisting of a capital letter inside a rhombus ![]() , both magenta coloured. The diamond symbol is placed on the chart for the location where tidal stream data is available, and tabulated elsewhere in the chart.
, both magenta coloured. The diamond symbol is placed on the chart for the location where tidal stream data is available, and tabulated elsewhere in the chart.
On any particular chart each tidal diamond will have a unique capital letter starting from “ A ” and continuing alphabetically. This in contrasts to the lower case letters in squares used for the vertical movement of tides, see Tidal levels in the chartTidal levels in the chart.
Somewhere on the same chart – generally on land – will be a tidal diamond table such as the one shown below:
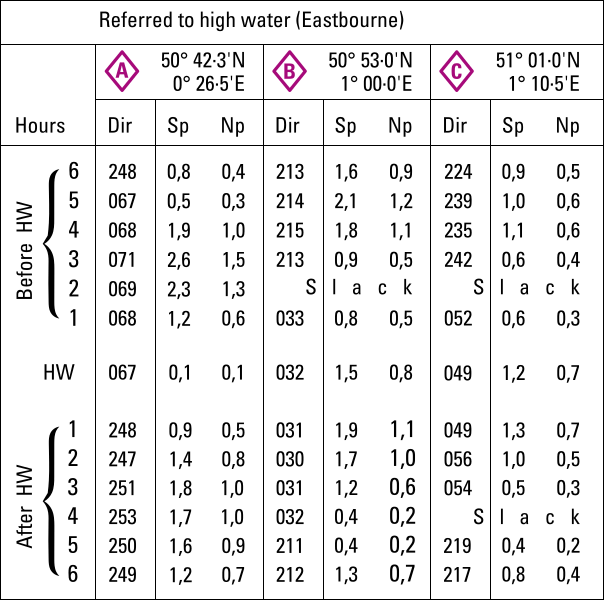
Tidal information in the chart, corresponding to the locations of the diamonds, containing a grid of thirteen rows and three columns for each diamond.
Columns of the diamond table
The three columns show the bearing / direction / set of the tidal stream, and its speed / drift / rate, in knots, at both spring tide and neap tide.
- Dir : Direction of streams (degrees).
- Sp : Rate at spring tides (knots).
- Np : Rate at neap tides (knots).
Note, that “Dir” is direction towards as opposed to wind directions.
Rows of the diamond table
The thirteen rows are the hours of the tidal cycle showing the 6 hours before high water, high water itself and the 6 hours after high water.
The times on the table are related to the moment of high water of the standard port or reference port. In this case Eastbourne harbour in England.
There can be a LW slack water before flooding and there can also be a HW slack water before ebbing: the tidal flow turns and changes direction, indicated by S l a c k.
Conversely, during ebbing and flooding the rates are strongest.

Approach of Saint-Malo.
Working out the tidal rates between HW and LW
and on days of non-springs and non-neaps, i.e. intermediate tides.
Tidal atlases vs tidal diamonds
Tidal diamonds give the tidal streams at that location only, an adjacent diamond may yield very different sets and rates; sensible interpretation and comparison is integral to estimate the streams at intermediate positions.
Where tidal diamonds have the advantage of precision, particularly in terms of direction – which can be difficult to measure on the chartlets of a tidal stream atlas – the latter has the advantage of creating a good overall view of the changing patterns of the tidal streams, especially for positions in between tidal diamonds.
Mind that both types of presentation use relative times with respect to HW (or sometimes LW) at a particular port, instead of clocktime.
Three ways to deal with tidal streams
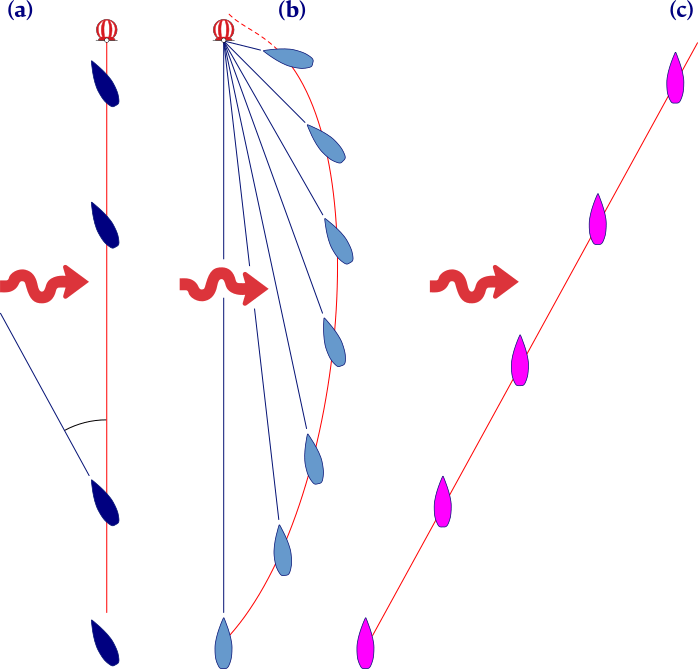
(a) When both set and rate are known, you can point the vessel upstream and counter tide, this is done with a Course to Steer (CTS).
(b) If no tide information is available, a (usually) curved course will get you to your destination. In aviation this pilotage technique is called “homing”.
(c) Go with the flow: sometimes it isn't useful to correct for tide, also if no AtoNs are within sight, an Estimated Position (EP) is plotted.
Course to steer
Being able to plot and understand the Course to Steer (CTS) is an essential skill to realise safe and efficient navigation.
First, despite the supposed similarities, the CTS is unlike an Estimated Position. In fact, the objectives of CTS and EP calculations, are diametrically opposed.
A tidal EP tells us where we are likely to be now, by plotting the sailed course (Water Track) and distance from the last know position and adjusting for leeway and tidal streams; a similar result is obtained with a non-tidal EPnon-tidal EP that combines dead reckoning with a single LOP, thus improving a DR position.
An EP is therefore one of many methods of position finding, answering the first question in navigation: “ Where are we? ”.
In practice, we rely more on satellite navigation than an EP – or any other method – to verify the position, because it is quick and generally reliable.
There is however only one way to answer the second question, “ Where should we go now? ” or rather “ How do we get there? ”, and that is the Course to Steer.
The CTS method is unique because it involves predicting the course that will take the yacht to a chosen position in the future; taking into account:
- Any leeway
- The tidal stream that will be experienced
- The estimated speed of the yacht
A Course to Steer is therefore calculated in advance; it is a form of pre-planning, adjusting the way the yacht is heading before setting off, in order to prevent the tidal streams and the leeway from pushing the yacht off the desired track.
By design, a basic chart plotter cannot do any of this. If the destination is a waypoint the plotter will calculate the direction towards it and keep updating that as the yacht moves, but it will not take into account the tidal streams, because most plotters won't have that information. Nor will it be able to estimate leeway for us.
The yacht may be pushed away from the intended track – with too much XTE (Cross Track Error), see Figure 8.5 (b) – possibly into a dangerous situation.
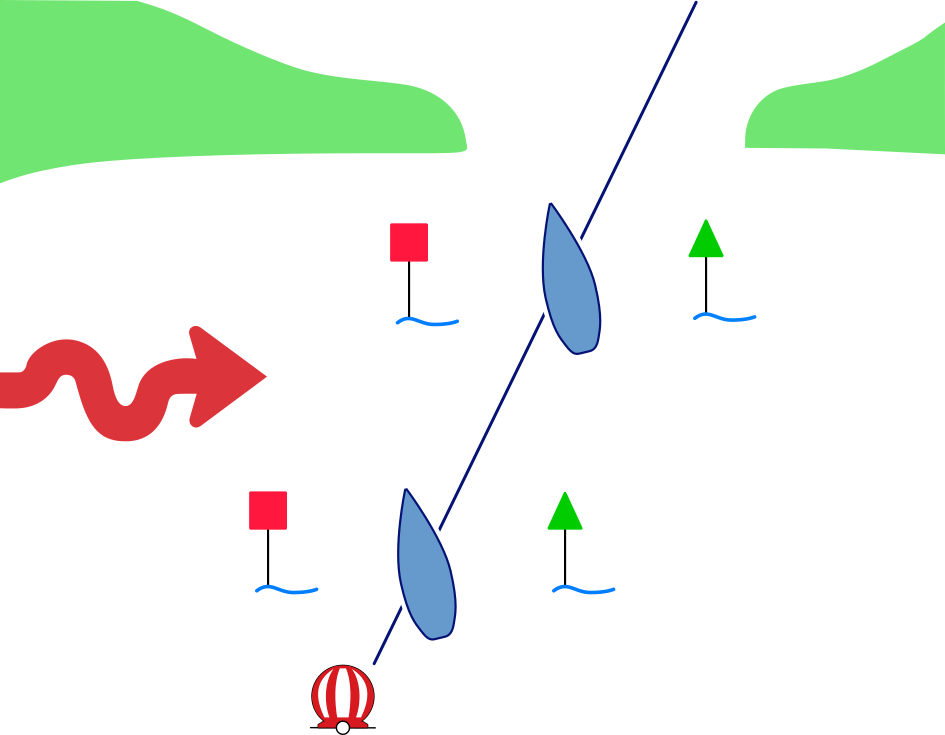
The buoys tell you by how much you have to steer upstream to counter the tide and stay in the channel.
Note that there are plenty of chart plotters that have weather routing and tidal overlays. We use a B&G Zeus³S in combination with PredictWind , but plotting a CTS still has to be done on a paper chart.
After we have calculated a Course to Steer, even the most basic plotter can be invaluable for verifying that our CTS is indeed keeping us on the right track. Actually, without the plotter and without anything on which to take a bearing, it can be impossible to check a Course to Steer.
We may only know that we made a mistake when the buoy fails to appear!
The fundamentals of a Course to Steer are illustrated by Figure 8.6 showing a yacht that is steering along a buoyed channel in a strong crosstide.
The experienced helmsperson can see and feel that the yacht is being pushed sideways by the tidal stream, and will instinctively head up into the tidal stream to compensate, similar to steering upwind to compensate for leeway as discussed in Chapter 4compensate for leeway as discussed in Chapter 4.
A Course to Steer is quite similar, yet without the buoys we cannot see and estimate the effect of tidal stream and cannot verify by how much we should steer up-tide. In nearly all scenarios we will need to calculate the tidal stream using tidal diamonds or tidal stream atlases, in combination with the speed of the yacht.
The basic method of calculating a CTS is very straightforward and has to be worked out in advance, before the yacht arrives at the position where we intend to alter course. Figures 8.7, 8.8 and 8.9 show the step-by-step construction of a CTS diagram that will provide us with a Course to Steer to the safe water mark.
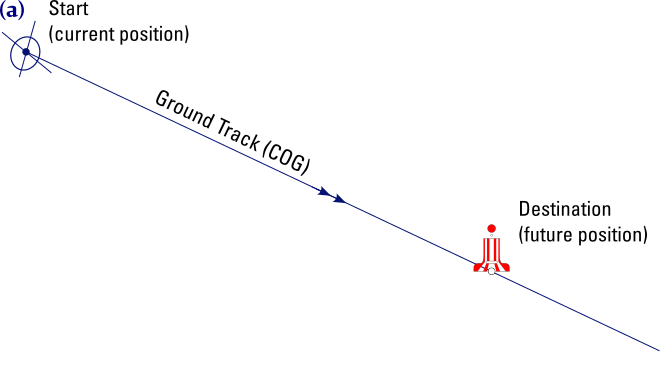
1. Plot the Course over the Ground (COG) aka Ground Track on the chart.
This is the line that the yacht will follow, so take care that it does not cross any hazards like shallows or rocks. Always extend the line beyond the destination (here a safe water buoy) to avoid mistakes in plotting at a later stage.
Mark this line with two arrowheads.
2. Estimate how long it will take to get there.
We will use one hour at average boatspeed.
This does not has to be precise, just measure the distance to travel, and use the average boatspeed, working to the nearest convenient hour or half hour.
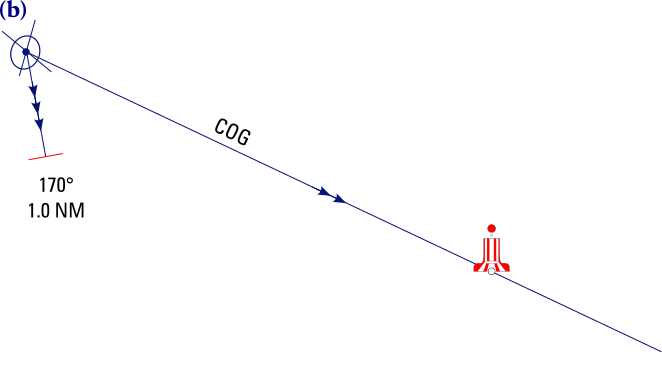
3. Calculate the tidal streams that the yacht will experience.
This is pre-planning don't forget, so it must be future tidal streams.
The information for this is taken from either a tidal diamond or a tidal stream atlas.
4. Plot the tidal streams from the start (our present) position.
This is a vector with a direction (170°) and a length (1 NM).
Mark this line with three arrowheads (the red line is just here to highlight its length).
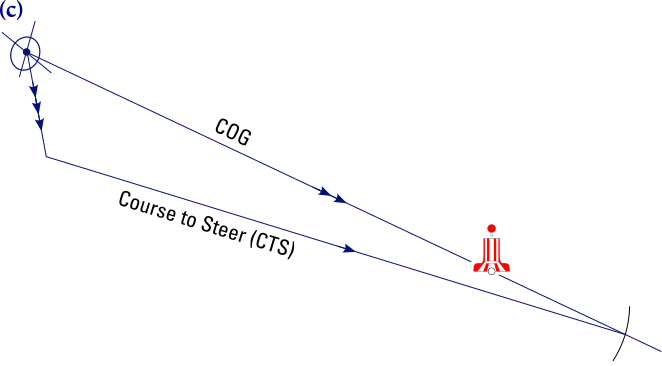
5. Now the effect of the speed must be considered.
Use the average speed of the yacht through the water from the log.
If this is a one hour diagram, set the dividers to one hour of boatspeed and mark this distance from the end of the tidal stream vector to the point where it meets the Water Track aka COG line.
Draw a line from the end of the tidal stream vector to this point. Bravo this last line is the Course to Steer; mark with one arrowhead.
The Course to Steer from the chart will be in °T, so adjust for variation and deviation before telling the helmsperson.
Do not just draw the line from the tidal stream vector straight to the destination; although neat it is wrong since each side of the triangle should represent the same period of time (here one hour).
6. Consider leeway.
How much the wind may push the yacht off the COG needs to be allowed for before telling the helmsperson the CTS… more on this later.
Finding time of arrival
Just a quick look at a finished CTS diagram should be enough to find approximately when the boat will arrive.
A rough estimated time of arrival (ETA) is quite good enough usually, and useful too. It saves us worrying when we fail to sight the next buoy ages before it will be visible, see Figures 8.10 and 8.11.
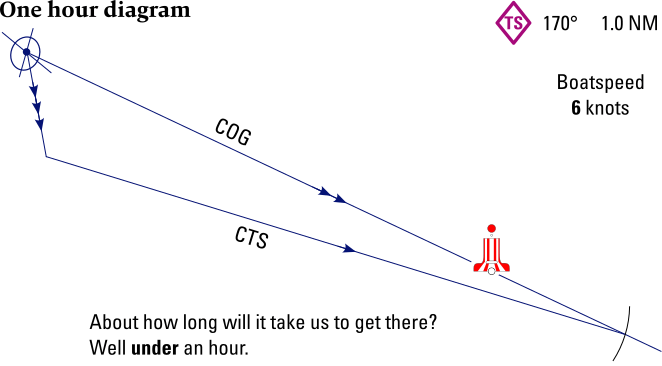
Estimated time of arrival: we can expect to see the buoy appear in well under an hour.
(TS stands for “tidal stream”)
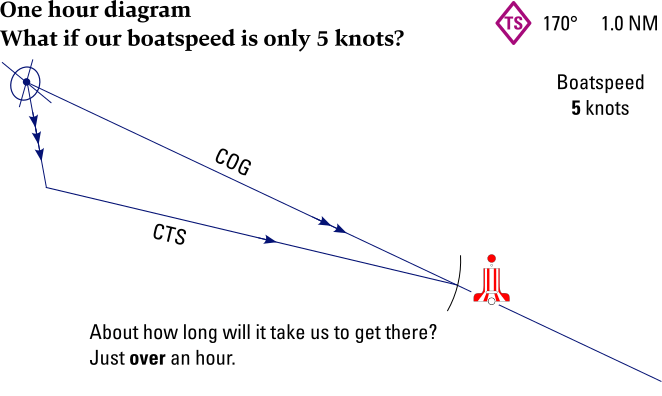
ETA: with this slower speed we can expect to see the buoy appear in just over an hour.
For passage planning it is customary to involve the buoys as waypoints along the route. However, bear in mind that buoys can be a little off their charted position.
Also, although using a buoy is convenient because it is easy to know when you have found it, and the buoy gives us a fix of position, be cautious. In poor visibility or in the dark the boat could come dangerously close to a very solid object. Motor cruiser skippers often set the waypoint a bit downtide, and not dead on, the buoy because of their speed.
Plotting a Course to Steer is a straightforward step by step construction.
Yet, guard yourself against two common mistakes: what has gone wrong with the diagrams in Figures 8.12 and 8.13 ?
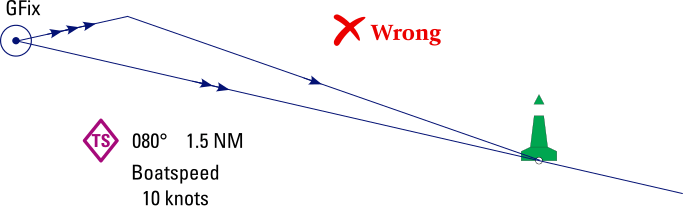
The mistake is made in the last step…
Do not join up the tidal stream to the destination!
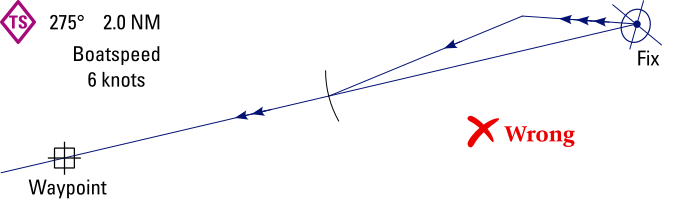
The second step went wrong…
It will take far longer than an hour to reach the destination, so we should initially plot a 2 hour diagram!
CTS • Breton Plotter
The outer edges of the Breton PlotterBreton Plotter have gradations (cm or inches) that we can use as “units”.
This makes it possible for us to draw a smaller scale vector triangle on the chart. Without the plotter we would be using the larger nautical miles measured off the latitude scale with dividers, yet mind that the smaller "units" produce identical angles.
Here is the ingenious workflow to plot a CTS with a Breton Plotter:
- Draw a line from our current position to where we intend to go.
- Find the appropriate set and rate from the nearby tidal diamond in our chart, or measure the angle of the relevant tidal arrow in the tidal atlas with the Breton Plotter.
- Mark off an hour’s worth of tidal “units” (rate) on the chart, at that angle (set).
- Instead of swinging off an arc of boat speed “units” with the dividers we can use the edge of the plotter. Pivot the instrument against a tip of the dividers if that helps.
- Align the grid of the protractor with the meridians and parallels, and read the course from the scale on the plotter.
- Adjust for leeway if necessary.
Using tidal diamonds • CTS
Now that we learned how to construct a basic CTS diagram, let's have a more thorough look at vectorization of tidal streams, and finding Course to Steer in practical scenarios.
As we intend to sail from A to B, see Figure 8.14, we locate the nearest tidal diamand and read the rate and direction for the time (relative to HW standard port) we are sailing. To counteract this tidal stream we shall construct a Course to Steer (CTS) on the chart.
First we draw a line from the starting point through the destination and beyond – this line is our Ground Track aka Course over Ground (COG) – and subsequently mark with two arrowheads in the middle.
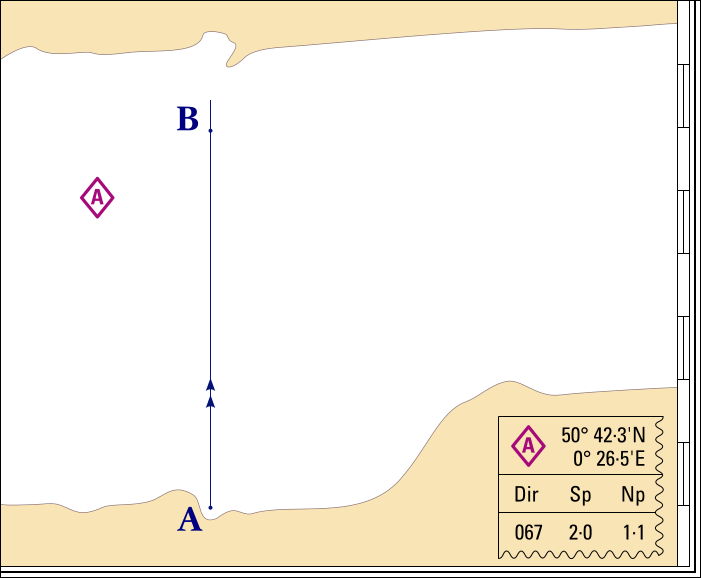
From the tidal diamond table in the chart we find 2 knots flowing in 067° direction for spring tide for the time of our crossing.
The Ground Track is marked with two arrowheads in the middle.
Vector and resultant
Any line drawn to scale showing a bearing and a speed is known as a “vector”, in coastal navigation we use tidal vectors to describe the tide's bearing and speed.
The “resultant” is the tidal vector sum of two or more tidal vectors.
Secondly, we transfer the bearing of 067° from the compass rose to our starting point, see Figure 8.15,
and because we have a spring tide we can use the full amount of 2·0 knots, without needing to interpolate between the neap and spring tides rates.
We measure 2 NM from the vertical scale opposite our position, since this is the distance covered in one hour with a speed of 2 kn.
Mark the tidal vector with triple arrow in the middle of the line, see the notation standardsnotation standards.
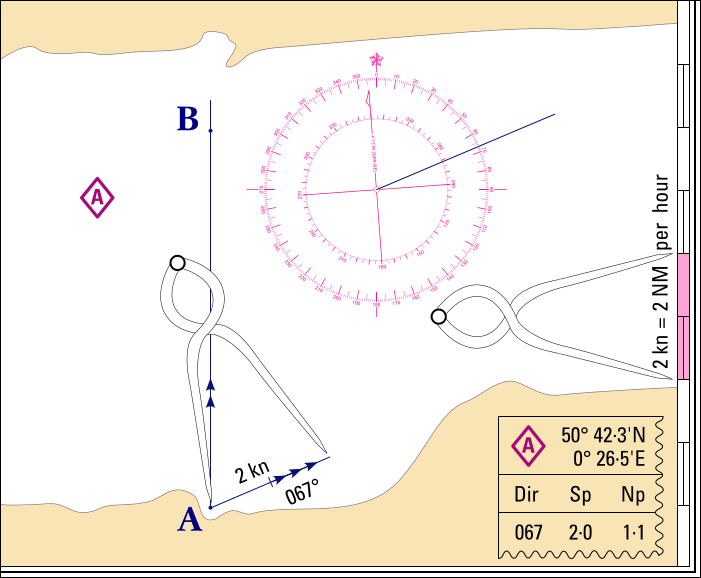
The vector's length is the distance of 2 NM covered in one hour with a rate of 2 knots.
The vector's bearing is 067°.
The vector's origin is your starting positing.
For the last construction step, see Figure 8.16, we will assume our vessel's average speed to be 5 kn. We therefore measure 5 NM from the vertical scale opposite our position, since this is the distance we will cover in one hour with a speed of 5 kn.
From the end of the tidal vector we strike off an arc with a radius of 5 NM.
Where the arc intersects line A – B we draw a line which is our Water Track aka Course through Water (CTW), and mark it with a single arrow in the middle.
Note that the Water Track may meet the Ground Track before or after the destination, and this is why we drew the Ground Track through and beyond point B.
If we transfer this line back to the compass rose it gives us 338°T for our CTW.
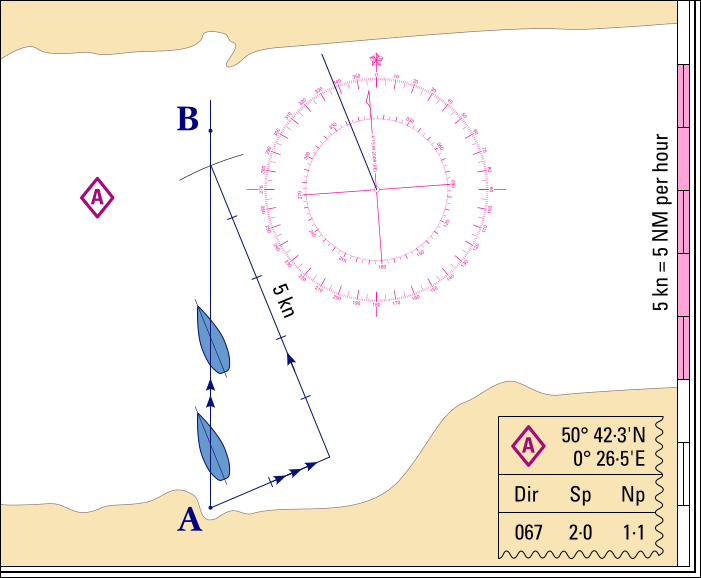
From the construction on the chart we can measure that our predicted speed along the Ground Track is 5.43 kn, indeed the tide is setting us north a bit. Note that drawing constructions on the chart is easy, yet for the trigonometry you might want to use an online calculator.
Further note that the Water Track rarely intersects the Ground Track precisely at our destination, and if this does happen there may be an error, verify that each side of the triangle represents the same period of time (here one hour).
Finally, to get our Course to Steer (CTS), we must adjust for leewayleeway (in case of cross wind), and for variation & deviationvariation & deviation resulting in a compass course to tell our helmsperson. We can use the equation below; remember that CTW = Course through the Water = Water Track is the conclusive line drawn in the construction, which is still a true course.
CTW ± leeway ± var ± dev = CTS
- Leeway: assuming a strong westerly wind we estimate the leeway to be −8° (with wind from port we must substract, hence the “minus”). The Water Track adjusted for leeway is 338° − 8° = 330°T.
- Variation: the inner compass rose tells us that in 2024 the variation is 2° 15' W = −2° 15'. Adjusting also for variation gives 338° − 8° − 2° = 328°M.
- Deviation: for a compass course that the helmsperson can steer by, we need to adjust for deviation as well.
Our deviation for sailing ~330° (the leeway is large enough to take into account) is about +3°, see the deviation tabledeviation table.
CTS = 338° − 8° − 2° + 3° = 331°.
Note that “to apply”, ”to correct for”, ”to adjust for” and ”to compensate for” are interchangeable in the context of variation, deviation and leeway.
Finding time of passage
The equation for working out how long it takes us to reach our destination B is straightforward, since speed equals distance divided by time, and rewriting this gives:
T = Time period
D = Distance to travelS = Speed of the vessel in that direction
Less straightforward is deciding on the vessel's speed. This is explicitly not the 5 kn that we estimated, since this is the Speed through Water (STW) which takes no account of the tidal effect. What we actually need is the Speed over the Ground (SOG).
To find the SOG we go back to our finished construction in Figure 8.16 and measure the distance from A to the point where the Water Track meets the Ground Track.
The measured distance is 5.43 NM and if we plotted lengths for one hour, the vessel's SOG will be 5.43 kn.
If the construction had been based on e.g. a half hour passage the SOG would be 10.86 kn because the vessel would cover 5.43 NM in half an hour.
The distance A – B likewise is measured on the chart and is 6 NM.
If we multiply this by 60 minutes we have our time of passage in minutes.
Allowing for several tidal streams
With opposing tidal streams
Crossing a narrow channel and sailing from C to D, as shown in Figure 8.17, is a special case that permits mental arithmetic, since all tidal streams are neatly aligned in two opposite directions, i.e. rectilinear. So, instead of having to draw each tidal stream construction we can resort to a single one.
- Measure the distance across (32 NM).
- Estimate boatspeed (4 knots).
- Work out time of crossing (8 hrs).
- Add up all east and west going tidal streams for those hours. It isn't necessary to plot all the tidal vectors, and simply listing the speeds for each hours will do.
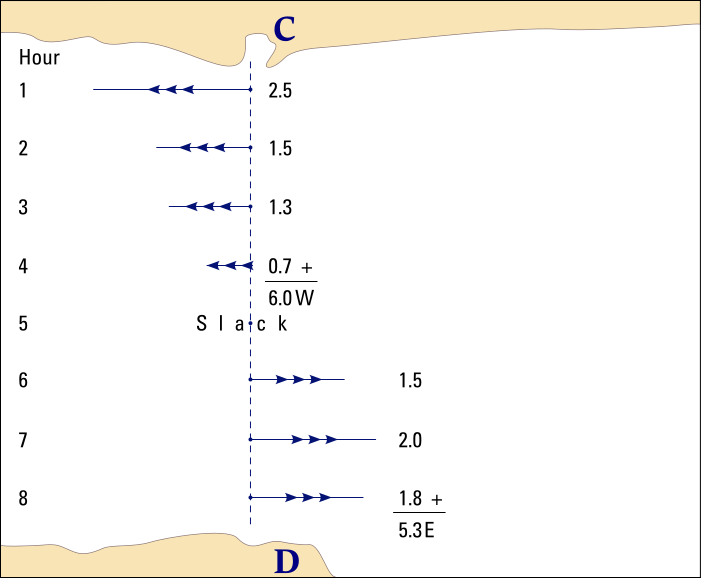
The tidal vectors are enlarged for clarity, but plotted mutually to scale. Recognise that plotting these is optional.
- Plot the balance (0.7W), which is the resultant tidal vector, see Figure 8.18.
Perhaps surprisingly , the (resultant) tidal vector may cross hazards or land, or finish at a hazard or on land. - Strike off distance travelled in time (4 knots × 32 NM) to give course.
- Apply leeway, variation and deviation.
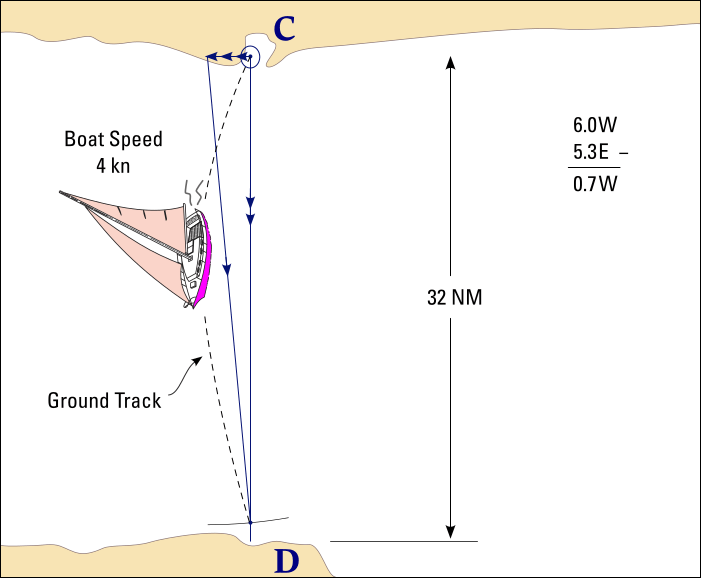
A tidal vector plotted over land is not an issue, since the Ground Track will start at point C not at the tip of the tidal vector.
Note that the Ground Track is curved and not a straight line south.
Channel width of 32 NM is not to scale.
With opposing tidal streams – crossing a wider channel
If tidal streams change direction every hour, i.e. rotary tidal streams, it is necessary to plot tidal vectors for each hour, as shown in Figure 8.19 for six hours, which is the estimated time it takes us to sail from E down to F.
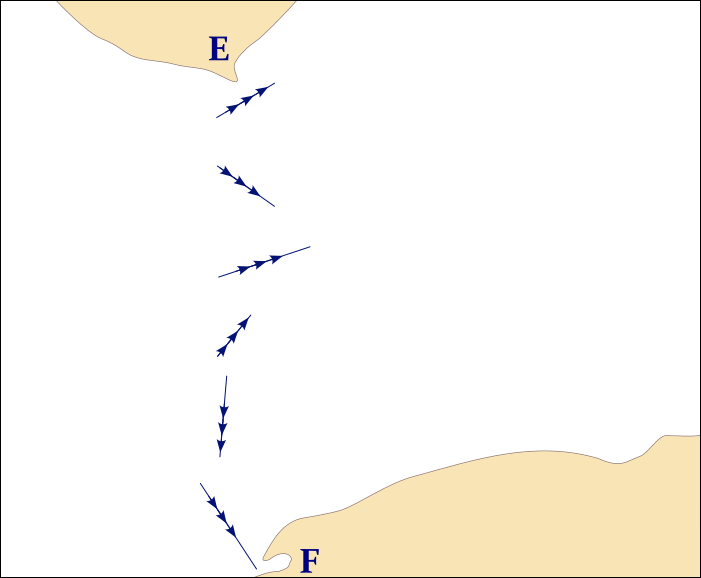
If the tidal streams have different directions (sets), we should plot the tidal vectors for each hour and location; here for a six hour crossing south. Mental arithmetic would be too error-prone, and constructing is the safe and easy method to find CTS.
Figure 8.20 shows the full construction; the first tidal vector starts at E and the other tidal vectors each start where the previous tidal vector finishes. From the end of this resultant, or tidal vector chain, strike off the distance travelled (speed × time) to find the course.
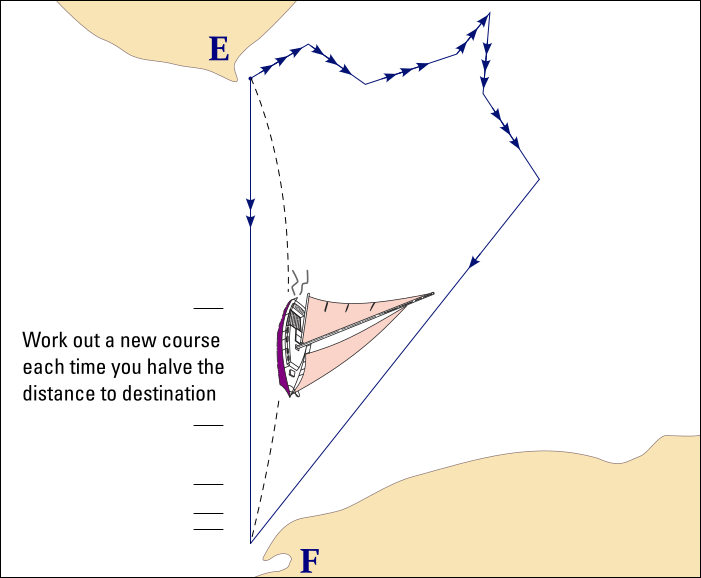
In other words: this resultant vector is a straight line that connects E to the end of the sixth tidal vector.
The dotted black line is the approximate Ground Track.
But as everything can vary on a long passage, plot an EP every hour, and work out a new course to steer each time you half the distance to your destination.
It is also good practice to aim off so you arrive up-tide of the harbour (or rather down-tide if the waypoint is a small hazard or buoy).
Course shaping
Applying Course to Steer, i.e. Shaping a course, is also useful to work out when to change course and where to place a waypoint. In the previous examples the destination was a given, now let's look at Figure 8.21.
We are currently at A and want to know when to tack so we can clear the headland by half a nautical mile.
- Draw an arc with a ½ NM radius around the cape.
- Mark in a Water Track at 045° to the wind.
- Measure down 5 knots for the boatspeed.
- Draw in 1 NM at 180°T for tide. (the “T” is optional)
- Mark in the Ground Track,
- …and extend it.
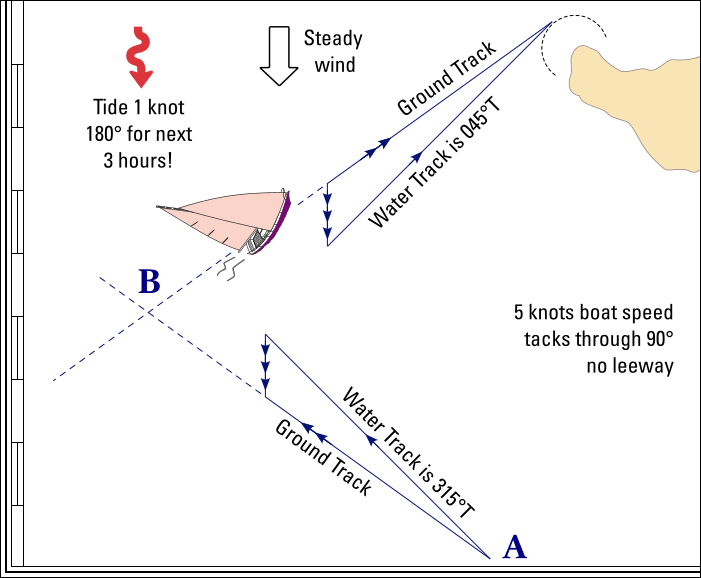
For calculating time to tack, remember to use Speed over Ground and not boatspeed, since the later leaves out the tidal influence.
The tidal stream slows our 5 kn speed though water (STW) to 4.25 kn SOG.
Even when the tide isn't constant during those next three hours, the steps are similar.
- Work out the Ground Track from point A,
- …and extend it.
- Where the two Ground Tracks cross B is the place to tack.
- The length of the Ground Tracks show that we are only making 4.25 knots over the ground.
- Measure the distance A – B, which is is 7 NM.
- Answer: we need to tack in about 1 hr 40 min.
Tacking to windward
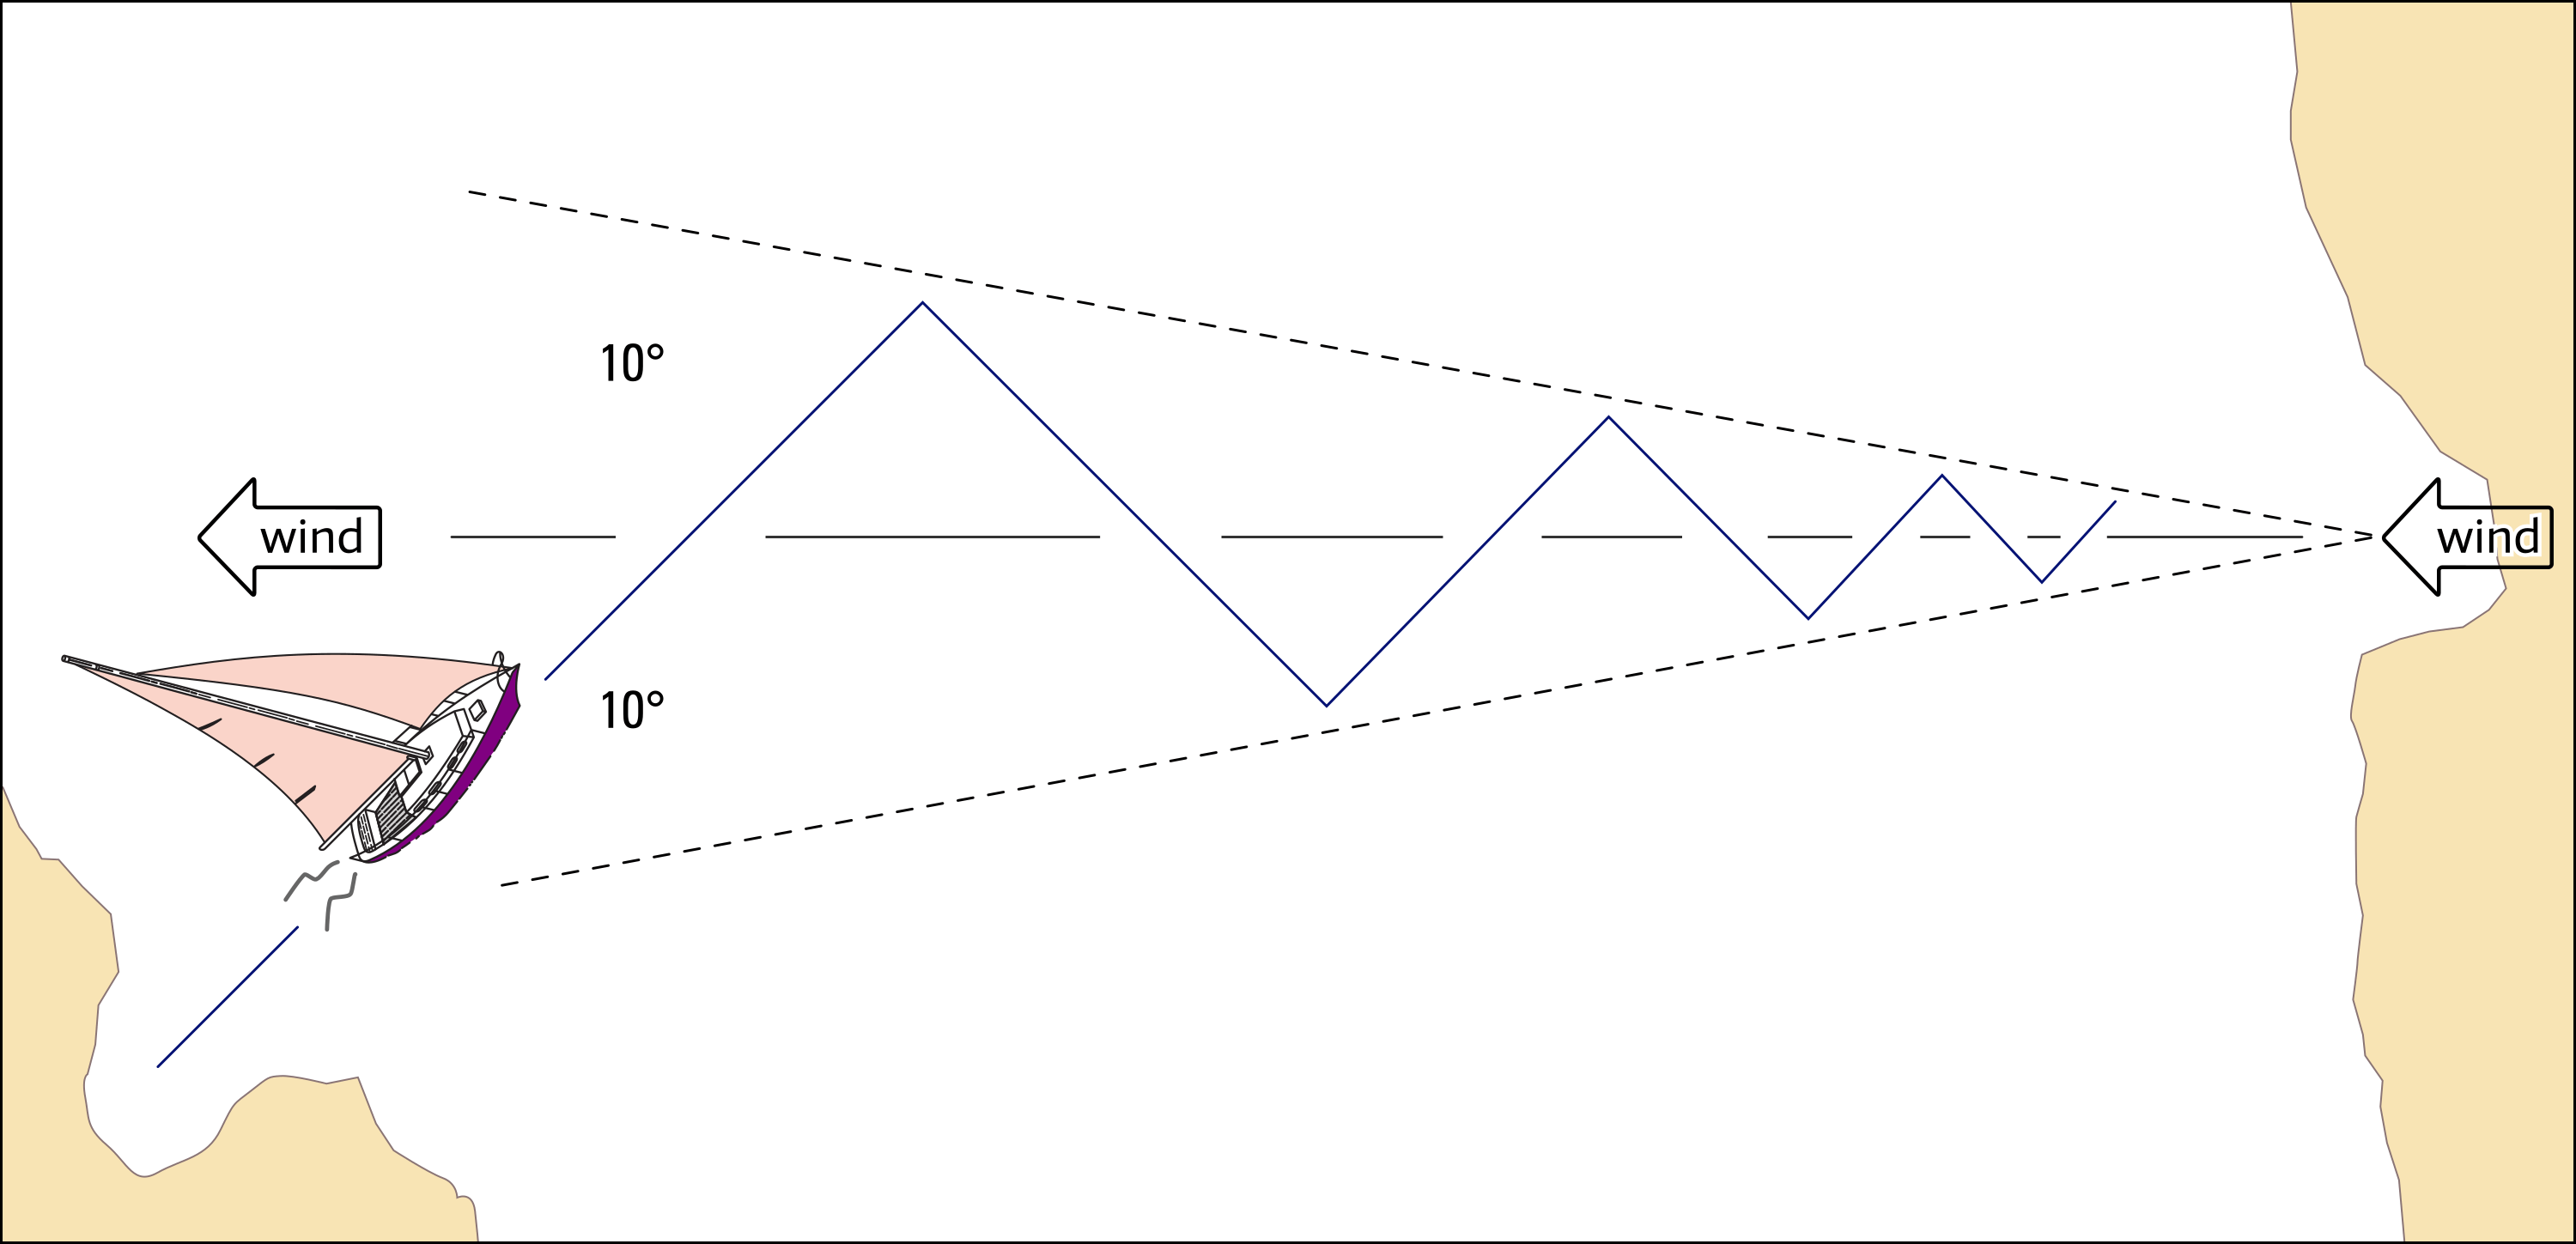
Without any tidal streams: if your destination is directly to windward, it is best to stay within 10° of the down-wind line (rhumb line), as illustrated by Figure 8.22, to take advantage of any wind shifts that might occur.
Always try to set off on the tack which is more directly towards the destination.
However, with a tidal stream the best wind strategy is lee bowing, i.e. keeping the tidal stream on the ship's lee bow, to sail on a lifted tack. To demystify this exploit we much first discuss apparent wind.
Apparent wind
The wind perceived on a yacht is affected by three separate factors.
- The first is the true wind experienced at that place, irrespective of yacht's movement.
- The second is the wind generated by the passage of the yacht through the air, which is an opposite direction to the yacht's course and at the same speed.
These two are combined to form a resultant which is usually known as the apparent wind, and is without flow of water.
- The third factor occurs when the motion of the yacht over the sea is modified by a tidal stream (or other flow). The apparent wind perceived onboard will be the resultant of waterflow, yacht motion through the water, and true wind.
These three factors contributing to the apparent wind are usually represented by the vector system, as detailed in Figure 8.23.
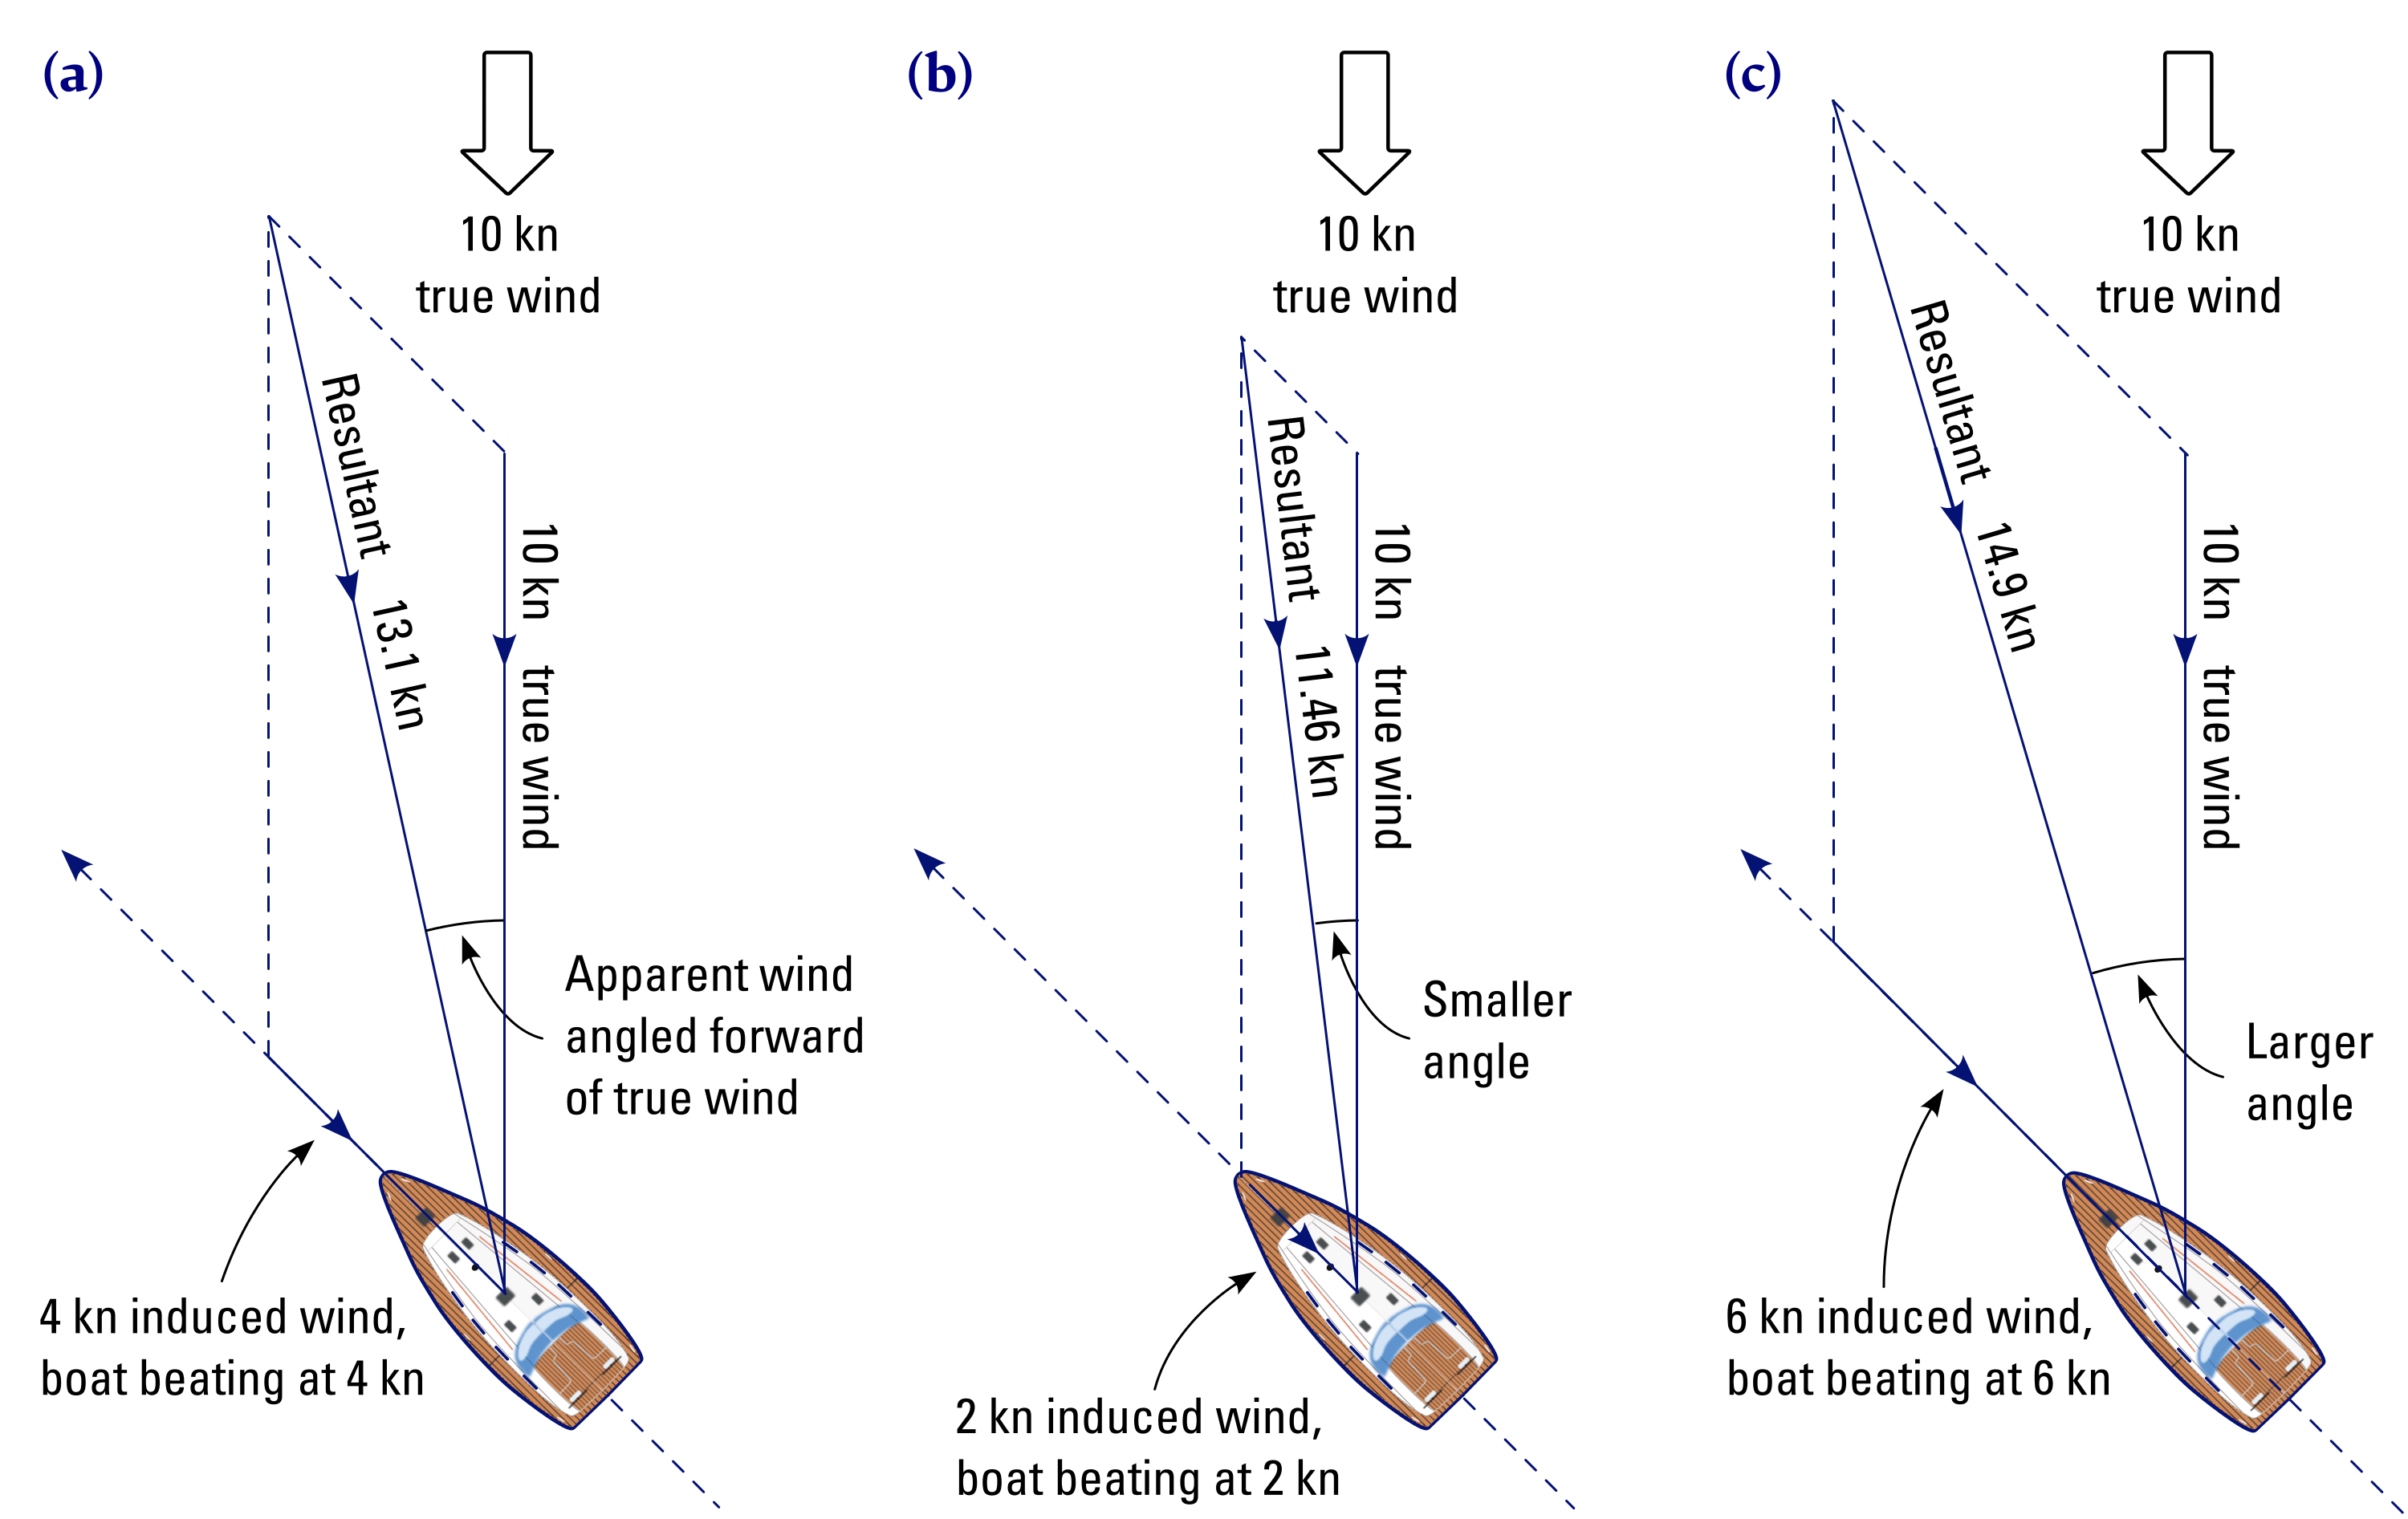
Motion wind combined with the true wind results in apparent wind (the resultant).
This motion wind is the induced wind from motion of the yacht, note that there would also be “tide induced wind” from motion of the water when tidal streams were flowing.
(a) 10 kn true wind combined with boatspeed of 4 kn, the apparent wind moves forward with 12°, and increases with 3.1 kn.
(b) 10 kn true wind combined with boatspeed of 2 kn, the apparent wind moves forward with a smaller angle of 7°, and increases with 1.46 kn. You could point up (not shown) or ease sails.
(c) 10 kn true wind combined with boatspeed of 6 kn, the apparent wind moves forward with a greater angle of 16°, and increases with 4.9 kn. You could steer down (not shown) or tighten sails.
Two worthwhile scenarios to reflect on:
- A yacht at anchor will only experienced true wind, e.g. 10 kn from the north, even in tidal waters. Motion induced wind is zero, and tide induced wind is zero since the yacht cannot be moving with any tidal stream.
- A motor boat travelling at 10 kn on a windless day without any water motion (tidal or otherwise) will only experience the induced wind of 10 kn directly on the bow caused by its own motion. True wind is zero, and tide induced wind is zero.
Lee bowing
But, if we have to allow for a change in tidal stream, an advantage is to be gained by letting the tide push us up to windward – just like yacht A is doing in Figure 8.24. Notice that this yacht is keeping the tide on the lee bow, hence the name lee bowing.
The tide and true wind act together to form a resultant wind or tide induced wind
which is lifting yacht A, and putting it in a good position when the tide turns.
But the same resultant wind will be heading yacht B on his chosen tack and placing it in a poor position when the tide turns.
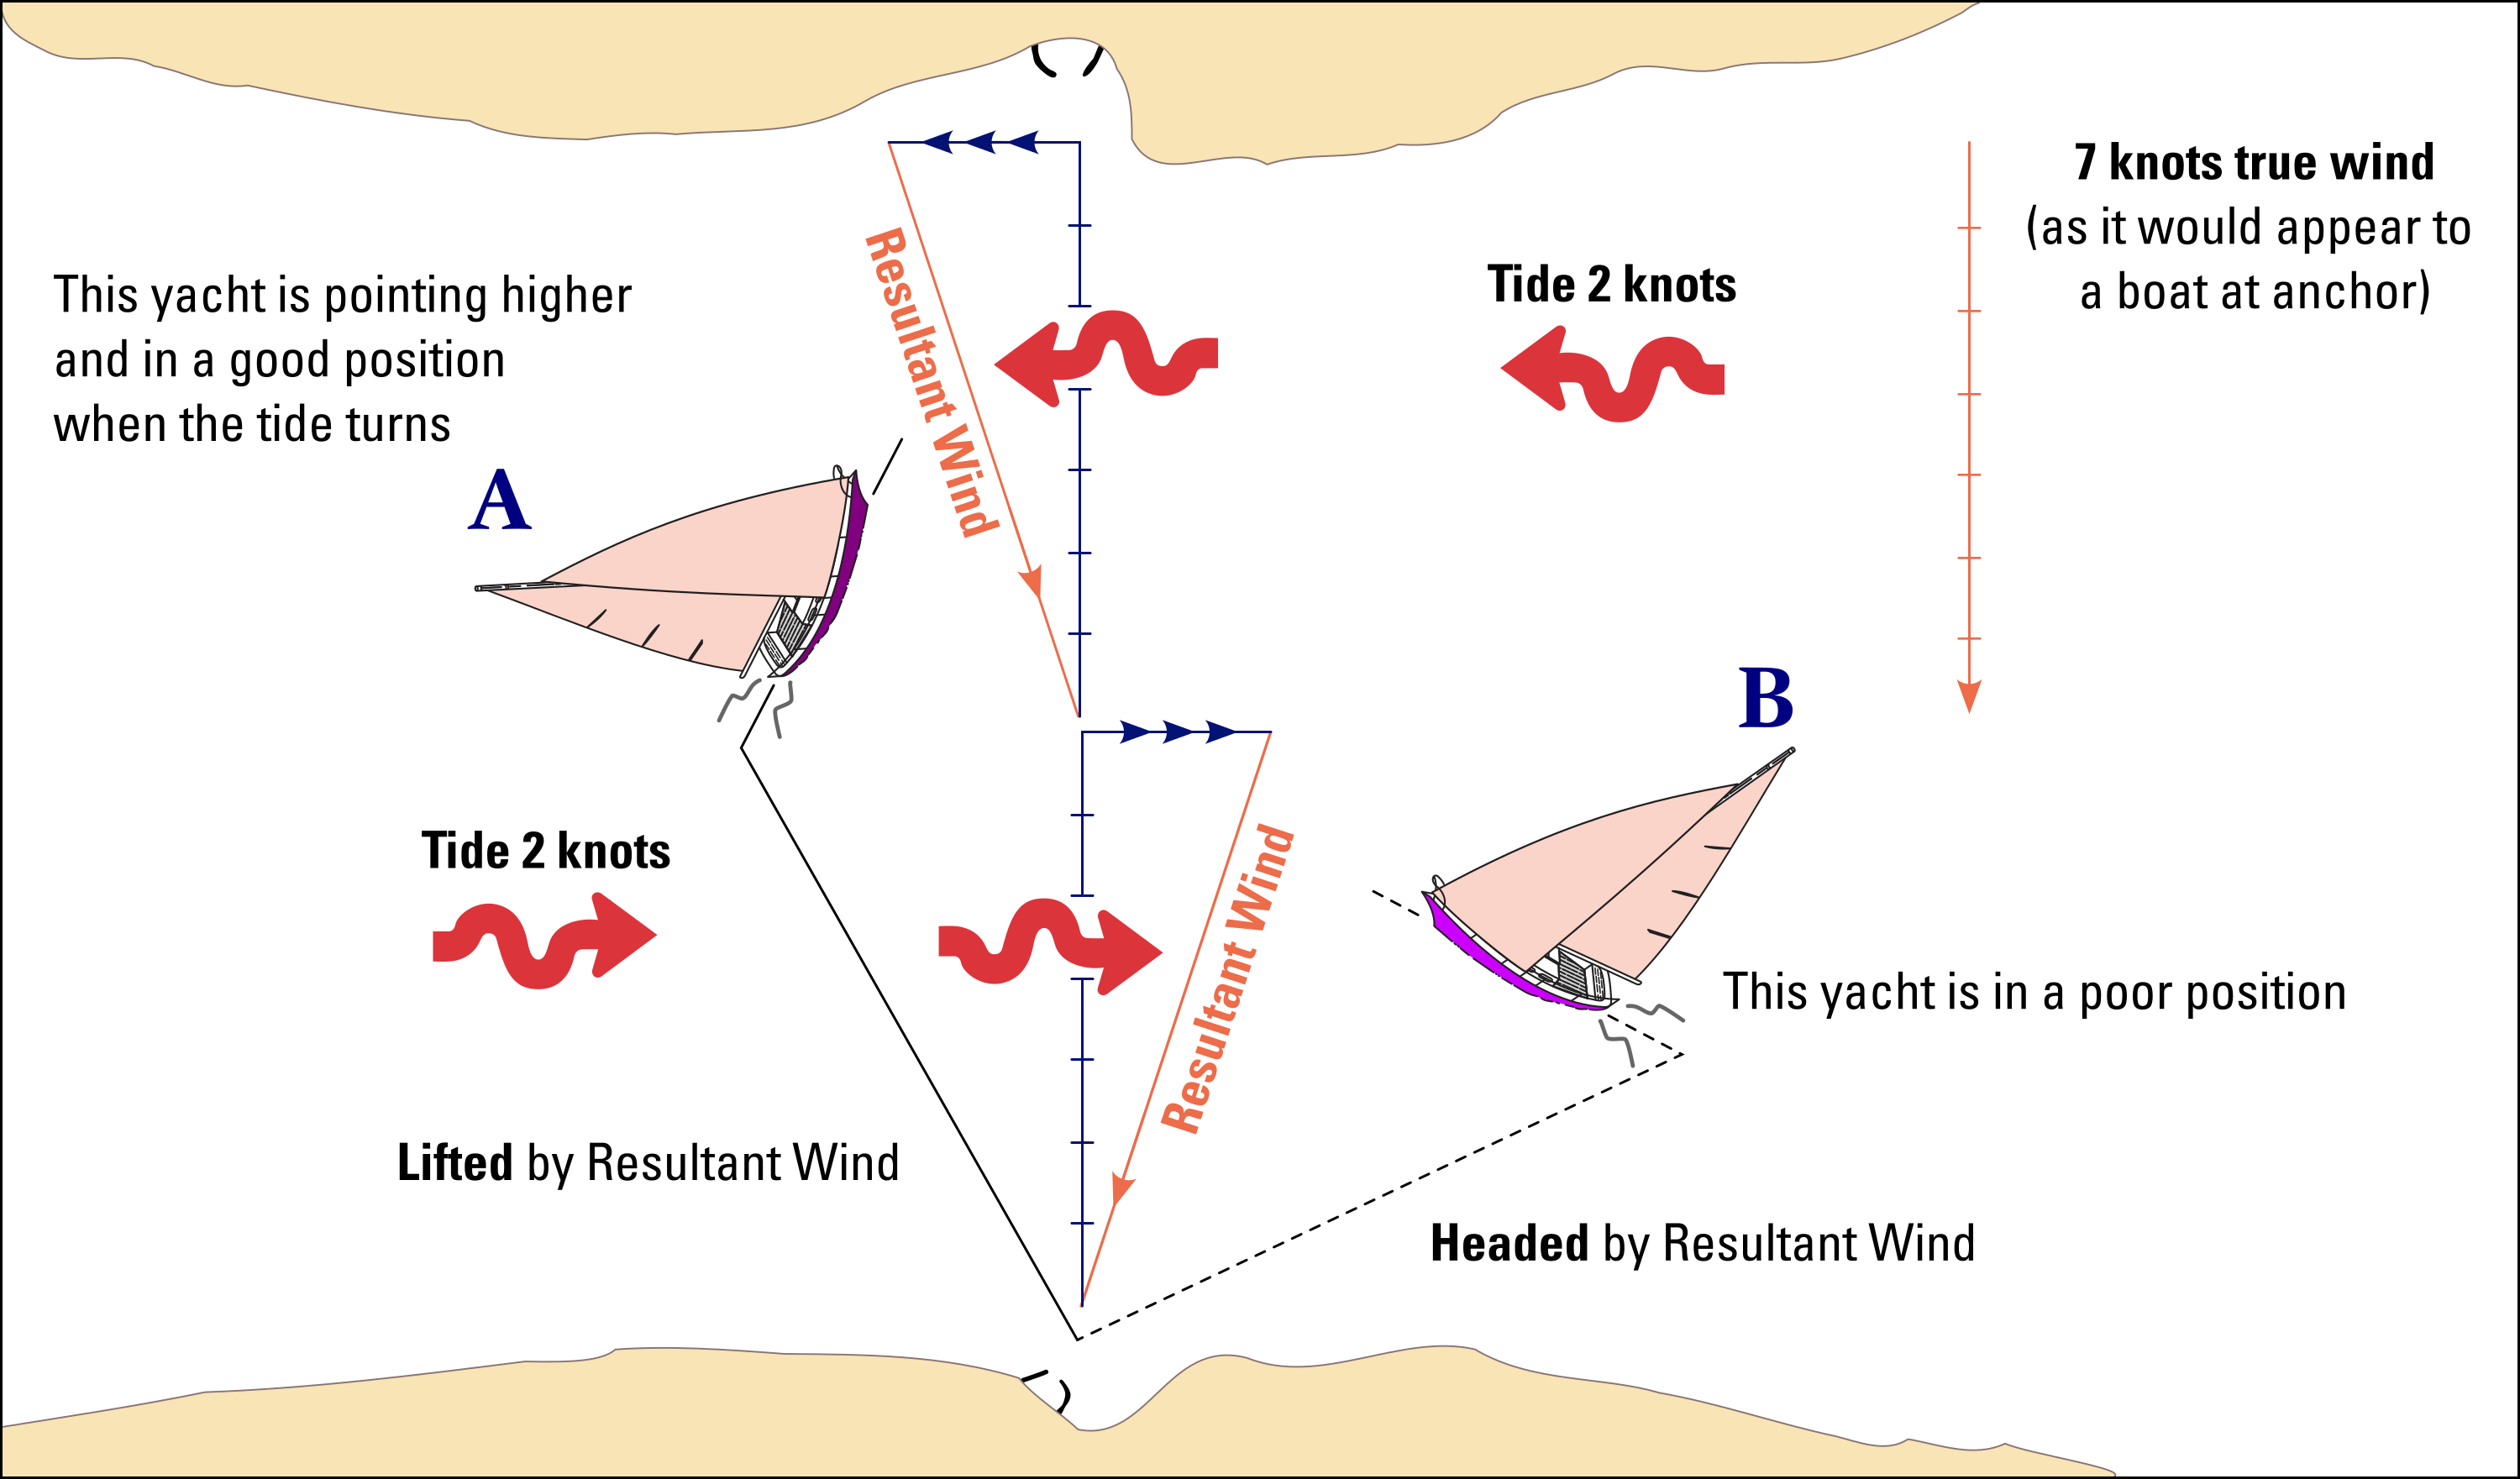
Mind that the “tide induced wind” effect drops off at slack water as the tide turns. While lee bowing might not seem to gain you much, the alternative of being pushed off in the other direction can be quite dramatic.
Passage planning in the real world it’s not so simple. The apparent wind direction can alter, so it then makes even more sense to keep close to the rhumb line and play the wind shifts.
Piloting or navigating
Fine points about passage planning: you are piloting if you can see your next mark, and you know exactly where you are. You are navigating if you can’t and don’t.
Two types of EP
1 – Non-tidal estimated position
We already explored the first type of EP in chapter 4chapter 4, combining a single LOP with
with dead reckoning (DR)dead reckoning (DR),
plotted on the chart with a square ![]() .
.
This version of EP is in essence non-tidal, since dead reckoning is based on course steered and distance travelled alone; it takes no account of leeway or tidal stream.
Combining the single LOP with a DR position optimises the certainty of our position.
2 – Tidal estimated position
The second type is the tidal estimated position, which is plotted on the chart with a triangle ![]() , and although both course and distance are plotted, this is distinct from dead reckoning, because tide and leeway are considered.
, and although both course and distance are plotted, this is distinct from dead reckoning, because tide and leeway are considered.
This estimated position also differs from Course to Steer, since leeway and tide are allowed to happen, and a CTS is meant to cancel out these forces. Moreover, EP means plotting what already has happened, whereas CTS means planning in the future.
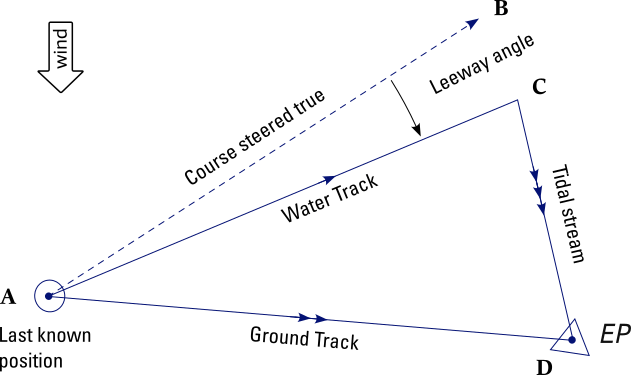
There are five steps involved in estimating an hourly position on a chart. Figure 8.25 illustrates how to estimate your position while allowing for tide and leeway.
- Make allowance for compass deviation and variation in order to get an accurate true course steered, dotted line A – B. This will amount to a few degrees only but becomes significant over a large distance.
- Make allowance for leeway to give a true Water Track.
- Draw a line in pencil from the last known position A on the chart and mark off the distance run in the previous hour in nautical miles, as recorded by the log.
- From this mark C then plot the tidal set and rate in knots from here.
- The final mark D is the vessel’s new estimated position (EP) and a line can then be drawn between it and the last known position A.
This line A – D is known as the Course made Good (CMG) or Ground Track and its length is the actual distance covered over the ground.
This distance, divided by the time (in this example one hour) also gives the actual Speed over the Ground (SOG).
Tidal streams and sea state
The wave conditions or sea state can be influenced by either tidal streams or winds, or by a combination of winds and tidal streams.
Notorious are the overfalls, races or tide rips that arise where strong tidal streams are deflected upwards to the sea surface or are broken up into turbulence by obstructions on the sea bed. These localized phenomena result in steep and irregular waves close downtide of the obstruction.
Often this happens within a tide race. The rough water is normally found on the down-tide side of the obstruction.
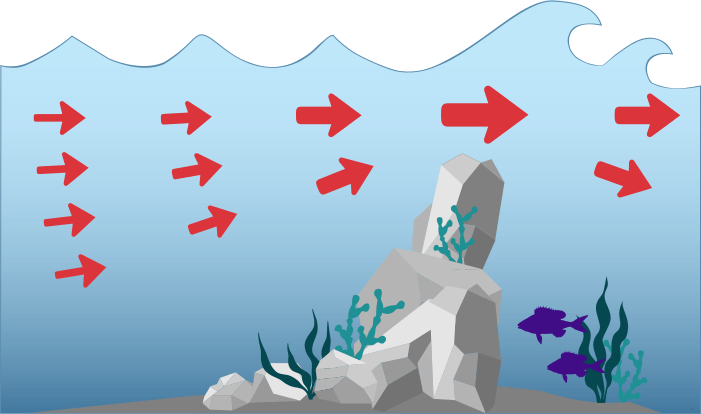
Tidal streams moving over a rugged seabed (coral or boulders), even when more than 10 metres deep, make the surface of the sea turbulent.
Though the severity of the overfalls is affected by certain wind conditions, they originate from the tidal streams interacting with the seabed and are not created by winds, hence they can be predicted and recurring and are marked on charts and tidal atlases as a potential hazard.
And hazardous these can be: have a look at the Corryvreckan whirlpool to get an insight into such ferocious tidal flows.
Symbols in the nautical chart for currents and tidal streams
| Flood tidal stream with rate | |
| Ebb tidal stream with rate, no feathers | |
 |
Relatively constant current (in restricted waters), non-tidal Variable current (in restricted waters), non-tidal |
 |
Overfalls
Tide rips Races |
 |
Eddies |
| Chart Diamond Position of tabulated tidal stream data with designation Magenta rhombus and upper case lettering |
|
 |
Breakers |
 |
Breakers near shoal water or the coastline |
 |
Breakers over off-lying shoals are charted by |
 |
 Ocean current. Ocean current. Details of current strength and seasonal variations may be shown: |
Rounding a cape: the increased speed of the tide will produce rougher sea conditions.
The calmest conditions will be 5 NM offshore, or very close in – the latter option brings you closer to rocks and other hazards, obviously.
Tide races will occur wherever the speed of the tide is accelerated by a constriction, such as a headland, see Figure 8.27, or forced through a narrow channel, Figure 8.28. This increase may produce currents of 10 or more knots in localised areas, probably far more than the official information indicates. In these conditions great care must be taken with the navigation as the vessel's position may be changing too fast for conventional navigation techniques.
The safest times to pass through a tide race are when tide is slack and when the wind is with the tide.
In contrast, avoid tide races or overfalls:
- In strong winds
- With the wind against the tide
- When the tide is at its strongest
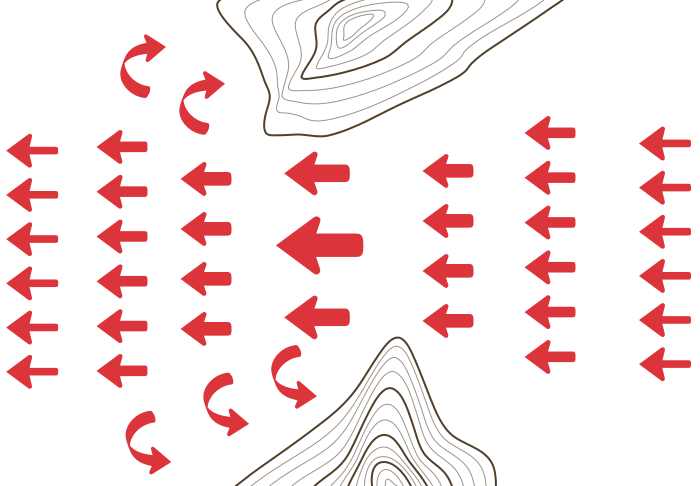
There may be local back eddies (hooked arrows) that form close to the shore, if you know the area well it may be possible to use these to make some progress against the tide, similar to sailing upstream between groynes.
Visibility
The turbulence in tide races or overfalls can bring cold water in upwellings to the sea surface. If the conditions for fog forming are on the threshold – such as when fog banks are forecast – the drop in sea surface temperature can cause fog banks, reducing crucial visibility at precisely these dangerous spots.
In general, fog will happen when the air temperature drops to within 2° C (5° F) of the dew point, and the air becomes saturated.
Signs of tidal flow
In tidal waters, it is important to understand what the tide is doing. With experience, it is possible to perceive tidal flow, perhaps by the ripples that a flow creates, or by the interaction of the tide with wind and swell. Note the difference between “seas” and “swells”.
In an area of variable tide, the wind will tend to pick out areas where the tide is flowing against it with small waves, whereas regions of opposite flow can appear flat.
Areas of flat water without ripples indicate where the flow is slow or forming eddies, in contrast with areas with notably steeper waves or ripples.
Also look for a debris line with visible seaweed, plastic etc, as a layer between the immiscible ebb and flood waters.
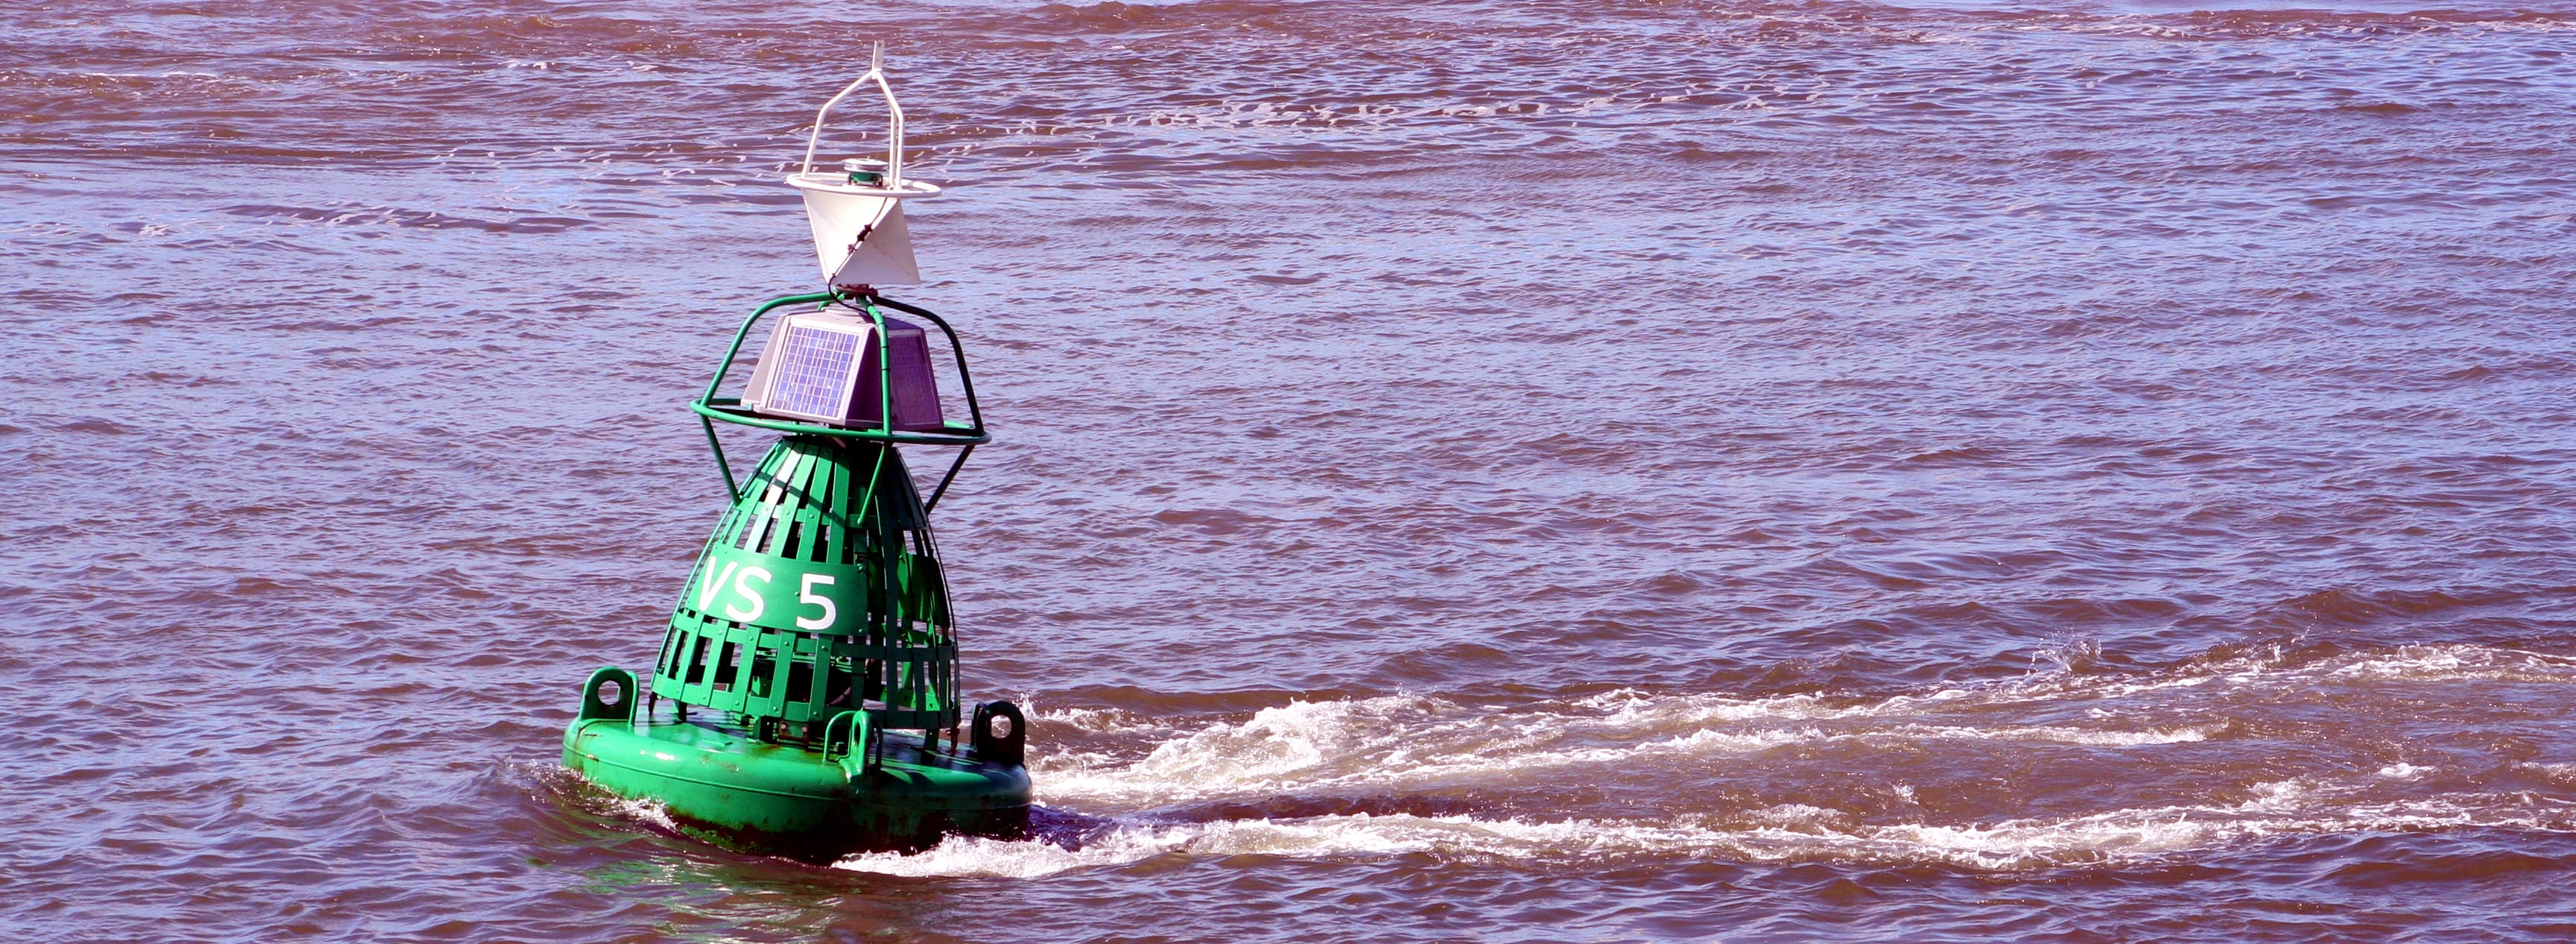
You can use AtoNs to assess tidal stream – look for the “cushion” waves ahead of a buoy or beacon and the flattened area behind indicate flow; more on waves, wind and tides.
Coastal tidal effects overview
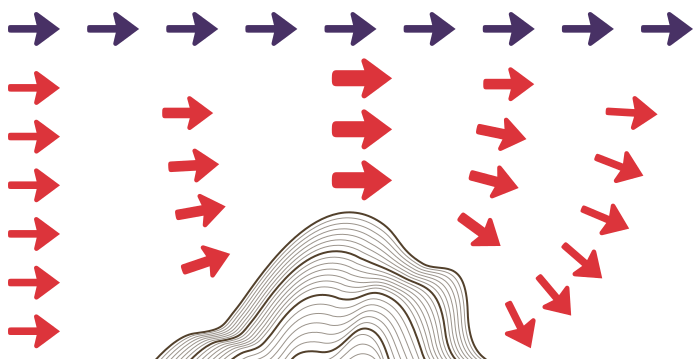
In coastal navigation it is crucial to understand that the shape of the seabed and surrounding land can greatly affect the speed and direction of tidal streams and local wave conditions, see Figure 8.30.
- A – In deep water offshore there is a strong tidal stream.
- B – Inshore in the shallower water the stream is less.
- C – Headlands and ledges can increase the rate of flow and cause overfalls as the water rushes and tumbles through the narrowed gap.
- D – Headlands and bays can also cause back eddies where the tidal stream can actually turn back on itself and swirl in the opposite direction.
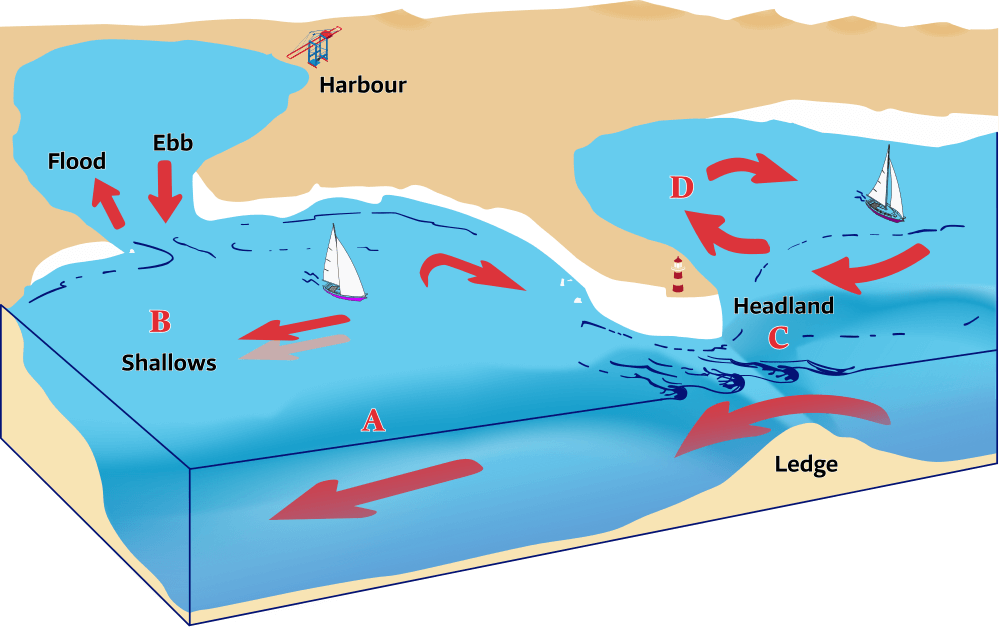
In the approach to the harbour, the tidal flow of water is funneled in and out the entrance of the natural port, accelerated around capes and jetted over seamounts, causing back eddies and overfalls: tide gates.
Both the reduced rate of flow in the shallows and the back eddies along the coast can be used to great advantage to sneak up over the tide.
Local knowledge, pilot books, or a close look at the tidal stream atlases will show where these areas are.
At the same time the confused seas caused at headlands should be avoided by small craft by either going inshore or going further out to deeper waters.
Again, pilot books will advise on the best route to take.
Wind over tide effect
Aside from the effects of coastal geography on tide, we should consider the influence of wind, which either creates smoother seas when blowing with, or creates rougher seas when blowing against the tidal stream.
This “wind over tide effect” results from waves being modified by tidal streams by increasing (Figure 8.31) or shortening (Figure 8.32) the wavelength relative to the height of the waves.

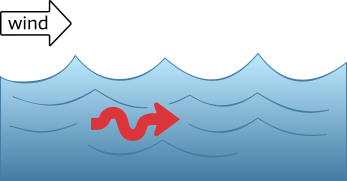 Figure 8.31 – “Wind over tide effect” with the current moving in the same direction as the waves, left to right –
The result is a smoother sea – not because the height of the waves is reduced, but because the wavelength is increased relative to the height of the waves, and the waves are therefore less steep.
Figure 8.31 – “Wind over tide effect” with the current moving in the same direction as the waves, left to right –
The result is a smoother sea – not because the height of the waves is reduced, but because the wavelength is increased relative to the height of the waves, and the waves are therefore less steep.

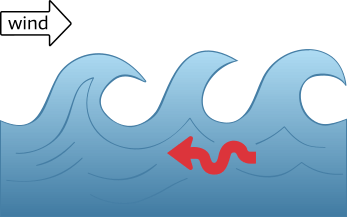 Figure 8.32 – “Wind over tide effect”, four hours later, with wind against tide – The tide has turned and the same wind strength, still from the left, is blowing against the ebb, causing choppy ‘wind-against-tide’ conditions and white horses.
Although not specifically related to tide, it is useful to recognise convergence of waves at headlands and divergence in front of the bays, see Figure 8.33, which can intensify or weaken the effects that coastal geography has on tidal flow.
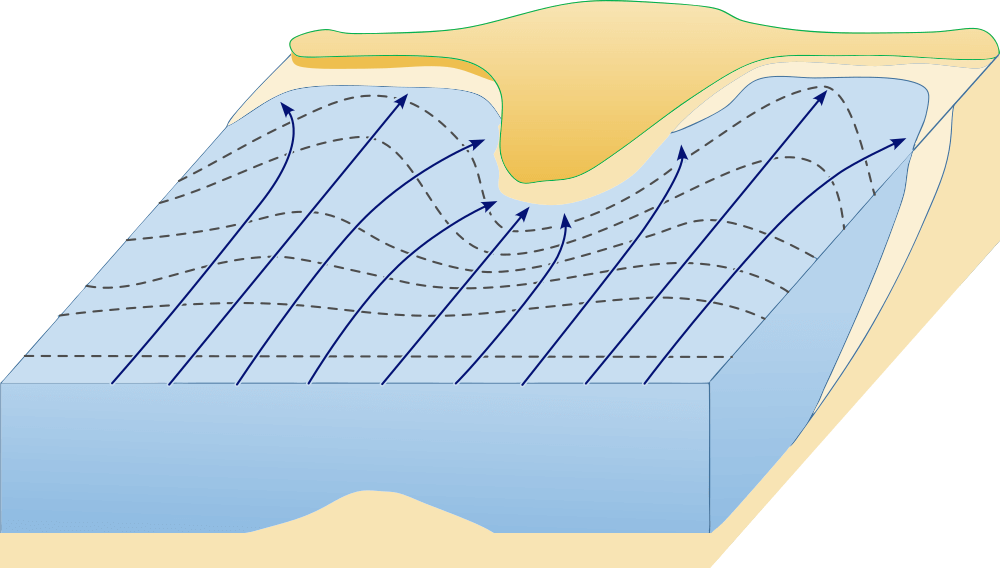
The approach of waves towards a coastal headland, with navy blue arrows illustrating the convergence and divergence;
most of wave energy is concentrated near the headlands.
Wind driven currents
Aside from gravitational (i.e. tidal streams), rivers, and the thermohaline imbalances which all influence horizontal movement of water, we should consider the remaining factor of wind.
Friction between the wind and water at the ocean surface results in a surface current flow at between 20 and 45 degrees to the direction to which the wind is blowing.
This effect will vary according to the depth of water, with smaller angles in shallow water and larger angles in deep water.
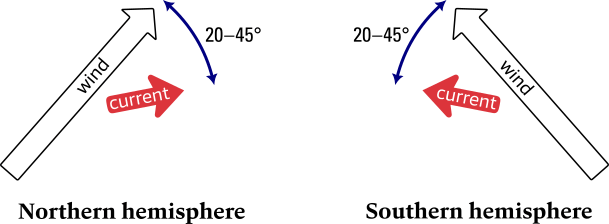
In coastal waters the angles are smallest.
The speed of wind driven current is typically about 3% of the surface wind speed, so in 20 knots wind you would expect a rate of 0.6 knots and in 30 knots of wind a rate of 0.9 knots.
Tidal gate
A final word should be reserved for tidal gates: the areas of coastal water where, at certain times, the flow of the tide prevents safe or timely progress in a given direction.
Above, we already discussed wind-over-tide, overfalls and tide races; rough situations where a vessel travelling at e.g. 4 knots will come to a standstill when faced with an extra 4 knots of contrary tide. Also, the faster tide might result in more treacherous overfalls.
The slower progress means that you will be in those adverse conditions for longer, causing wear and tear on both the crew and the vessel’s gear.
So, even though the tidal gate might not be literally shut, it will be prudent to wait until it is “open”.
Once the tide gate is “open” the tide will be with you, progress will be faster, safer and more comfortable and any time lost waiting might easily be made up.
Overview
- Flood: when the tide is coming in and filling the bay, fjord, firth or estuary.
- Ebb: when the tide is going out and draining the bay, fjord, firth or estuary.
- Slack: when the tidal flow turns and changes direction, a LW slack before flooding and a HW slack before ebbing: S l a c k.
- Springs: when the Moon and Sun are in alignment to produce the maximum gravitational pull and hence the biggest and fastest tides.
- Neaps: when the Moon and the Sun are at their weakest alignment so the gravitational pull is less and the tides are at their smallest and slowest.
- Range: the height difference between high and low water, which varies every day.
- Current: is a horizontal movement of water. Currents may be classified
as tidal and nontidal.
Tidal currents are caused by gravitational interactions between the Sun, Moon, and Earth and are a part of the same general movement of the sea that is manifested in the vertical rise and fall, called “tide”.
Nontidal currents include the permanent currents in the general circulatory systems of the sea as well as temporary currents arising from more pronounced meteorological variability.
In British usage, “tidal current” is called tidal stream, and “nontidal current” is called current.
The terms tidal current and tidal stream can be used interchangeably, but the polysemantic current always needs context. - Eddy: area of recircling water caused by main tidal stream flowing past a headland or obstruction. Eddies are larger and flatter than wirlpools / maelstroms.
- Set: the direction or bearing of a tidal stream.
- Drift: the speed or rate of a tidal stream.
- Gyre: a large system of circular ocean currents formed by global wind patterns and forces created by Earth's rotation.
- Ocean surface current: A continuous and regular movement of ocean water flowing along a definable path, maintaining the Earth's thermodynamic balance. Horizontal pressure gradients, winds and the Coriolis force are three prominent causes of these currents.
- Intended track: usually refers to the line connecting two waypoints of a route, i.e. a leg of a route we intent to sail aka the desired track. When we slip off of that track we can display how far off of the track we are, which is called the “cross-track error” (XTE).
- Tidal diamonds
 :
are shown on nautical charts, such as the example on the right for location “D”, at locations where tidal stream information has been measured: set and drift.
This information is included in the same nautical chart and tabulated in a tidal stream table.
:
are shown on nautical charts, such as the example on the right for location “D”, at locations where tidal stream information has been measured: set and drift.
This information is included in the same nautical chart and tabulated in a tidal stream table. - Tidal stream atlas: these show the tidal streams for each hour of the tidal cycle. These comprise a total of 13 (or 12) tidal charts ranging from 6 hr before HW till 6 hr after HW (high water in a certain standard port). So, these charts are relative to the time of HW and to use them we must know the absolute time of HW (or LW as in the example below).
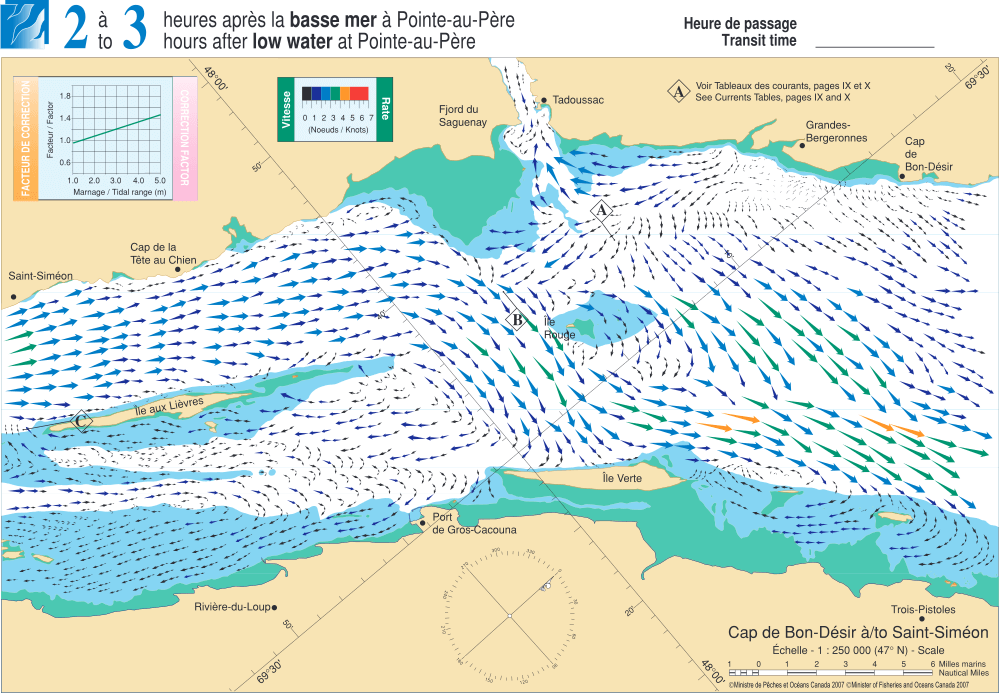
showing the estuary of St Lawrence river in Quebec, 2 – 3 hours after low water.
- Tidal atlas / stream arrow: have often associated numbers
(for example 11.20) that give the average speed of the current at neap and spring tide. In this example, the rate at neap tide is 1.1 knots and at spring tide is 2.0 knots.
- The thicker the arrow, the faster the water it represents is flowing
- Two figures relate to springs (bigger) and neaps (smaller)
- The decimal place is not included: e.g. 40 is not forty but 4.0
- Speeds are given in knots
- Fetch: the distance over open sea which the wind can blow. A bigger fetch will lead to bigger waves, and a smaller fetch will only produce smaller waves.
- Tide race: happens when the tidal flow is constricted or squeezed through a horizontal gap. it flows faster.
- Overfalls: where the tide is constricted by the sudden decrease in depth; a vertical gap. When the volume of water is sufficient and the speed of water is sufficiently fast this will result in surface turbulence.
- Apparent wind : the speed and direction from which the wind appears to blow with reference to a moving vessel, movement due to tide and / or movement due to the vessel's motion through the water.
- Resultant (vector): is the sum of two or more individual vectors, resulting in a single vector that produces the same effect as is produced by the individual vectors collectively.
- Vector: in physics, is a quantity that has both magnitude and direction, represented by an arrow whose length is proportional to the quantity’s magnitude. Although a vector has magnitude and direction, it does not have position. That is, as long as its length is not changed, a vector is not altered if it is displaced parallel to itself.
In contrast to vectors, ordinary quantities that have a magnitude but not a direction are called “scalars”. To qualify as a vector, a quantity having magnitude and direction must also obey certain rules of combination. - Vector system: a vector parallelogram for addition and subtraction.
- Course to Steer (CTS): involves predicting the course that will take the yacht to a chosen position. It takes into account:
- The tidal stream that will be experienced
- The estimated speed of the yacht
- Any leeway
- Estimated position (dead reckoning): is the combination of a single LOP with a DR position without allowances for tidal streams, currents and leeway, plotted on the chart with a square. This EP is very common when no tidal information is available and is an improved position based on a DR position.
- Estimated position (tidal): is derived from the last know position (Fix, Rfix, but also DR) with allowance made for leeway and the effects of currents and tidal streams. From the last known position a current vector with a length for the chosen time span is drawn to plot the EP.
This EP is plotted on the chart with a triangle.
The line between the last known position and the EP is the Ground Track, at least the estimation of it…
The tidal EP is a “go with the flow” sailed track, and therefore the opposite of an CTS when you plan to counter leeway and tidal streams by planning to steer upwind and upstream. - TSS aka a traffic separation scheme is where you should avoid sailing a CTS since a yacht should cross a shipping lane at a right angle to avoid endangering ship traffic, and to minimize the duration of the crossing.

Figure 8.36 – Correct crossing TSS and shipping lanes.
(a) Keep your keel direction (HDG) perpendicular to lane direction.
(b) Even with a crosswind (leeway) and currents (drift) this means no CTS to adjust for leewayCTS to adjust for leeway, no CTS to adjust for currents. - Pilotage: the art of finding your way around within sight of land, using visual references: piloting. It is considered distinct from “navigation”, which often refers to finding ones way away from land, or without good visual references: navigating.
- Course shaping: Also known as “shaping a course” or “Course to Steer”, is the estimated course that a vessel should steer in order to arrive at a specific waypoint, taking into consideration the effects that wind and tide will have on it.
- Lee bowing: The exploit of keeping the (tidal) stream or current on a sailing ship's lee bow to be lifted towards a windward destination, i.e. sailing a shorter distance.
- True wind: the wind relative to a fixed point on the Earth.
- TWA (True Wind Angle): the angle of the wind, relative to the yacht if it was stationary.
- TWD (True Wind Direction): the true direction of the wind relative to north.
- Motion wind (induced wind): the wind a moving vessel would experience in still air, without any flow of water.
- Tide induced wind: the wind a non-propelled vessel would experience in still air, due to flow of water.
- Wind driven current: also known as "wind induced current” or “wind generated current” is a flow in a body of water that is generated by wind friction on its surface. A well known oceanic wind driven current is the Gulf Stream.
- Wind over tide effect: when wind, or waves are going the opposite direction to a tidal stream, the waves become shorter, taller and often break. This can make for challenging conditions off headlands and in tide races. When wind, or waves aline with a tidal stream the seastate and sailing becomes smoother.
Sea roughest with wind against tide. 
Sea calmest if the wind is with the tide. - Tide gate: (tidal gate), is an area of coastal water that needs to be negotiated at certain times to avoid undue delays or dangerous situations such as “wind over tide” conditions, tide races or overfalls.
See the next chapter…
- Course overview: goals and introduction
- Positions: latitude, longitude, nautical mile, scale, knots
- Nautical chart: coordinates, positions, courses, chart symbols, projections
- Compass: variation, deviation, true • magnetic • compass courses
- Plotting and piloting: LOPs, (running) fix, dead reckoning, leeway, CTS, CTW, COG
- Advanced piloting: double angle on the bow • four point • special angle fix, distance of horizon, dipping range, vertical sextant angle, radians, estimation of distances
- Astronomical origin of tides: diurnal, semi-diurnal, syzygy, spring, neap, axial tilt Earth, apsidal • nodal precession, declination Moon and Sun, elliptical orbits, lunar nodes
- Tides: tidal height prediction, chart datums, tidal curves, secondary ports
- Tidal streams and currents: diamonds, Course to Steer, Estimated Position
- Aids to navigation: buoys, leading lights, ranges, characteristics, visibility
- Lights and shapes: vessels sailing, anchoring, towing, fishing, NUC, RAM, dredging
Also you can download the exercises + answers PDF ![]()