Weather graphs Athens
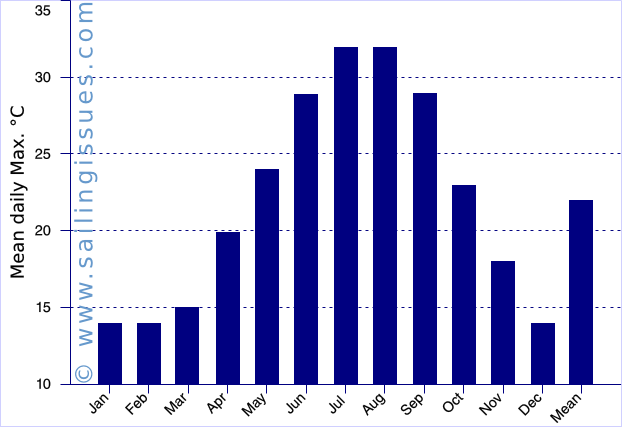
The data plotted below is a compilation of weather data from 1960 till 2006 and can be used for sailing in the Saronic Gulf, the Argolic Gulf and the northern Cyclades.
Also see:
- Seawater surface temperatures
- Meltemi winds
- Climate data Aegean Sea
- Windroses Ionian & Aegean
- Windroses Turkey
- Climatic data HNMS
- How to forecast rain: cloud reading
Due to the climate crisis there is an increase of extreme weather events.
Mean daily maximum temperatures per month
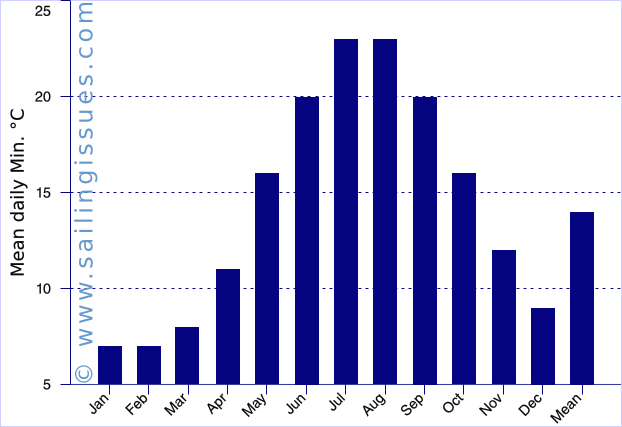
Mean daily minimum temperatures per month
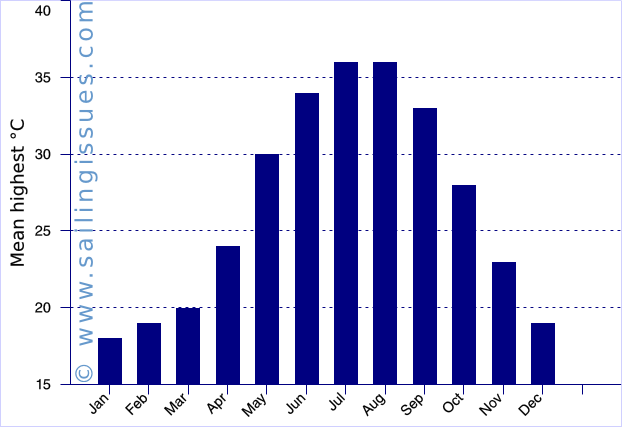
Mean highest temperatures per each month
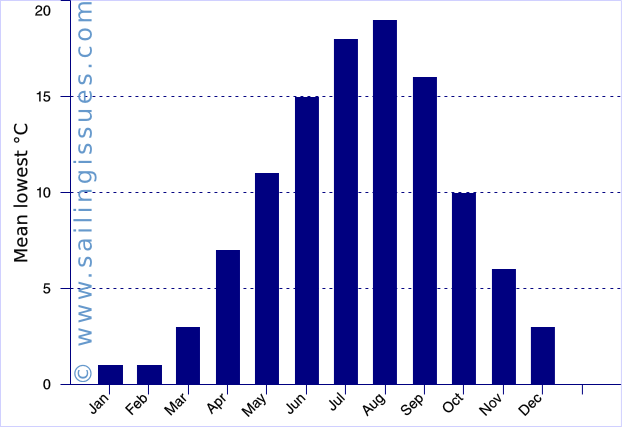
Mean lowest temperatures per each month
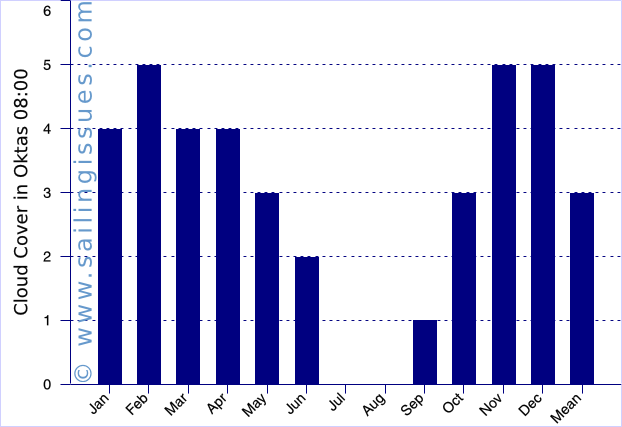
Cloud cover in Oktas 08:00
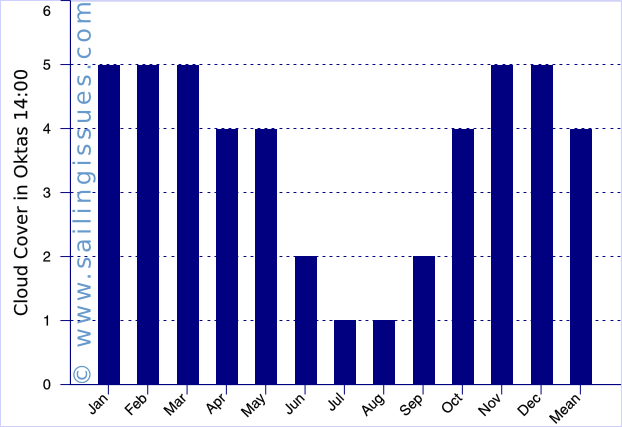
Cloud cover in Oktas 14:00
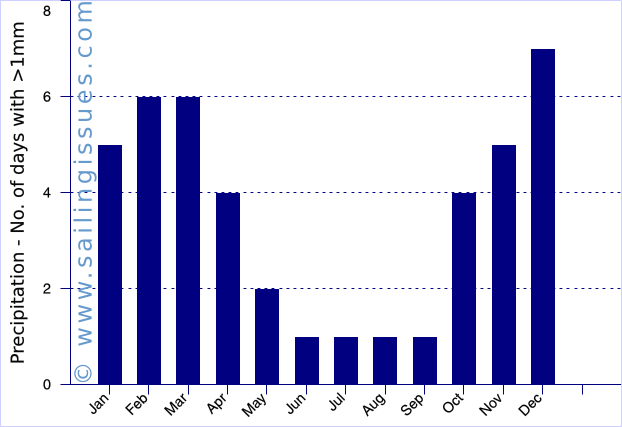
Number of days with >1 mm Precipitation
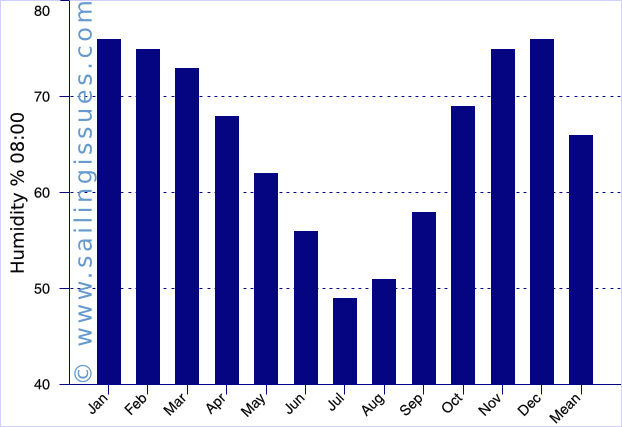
Humidity 08:00
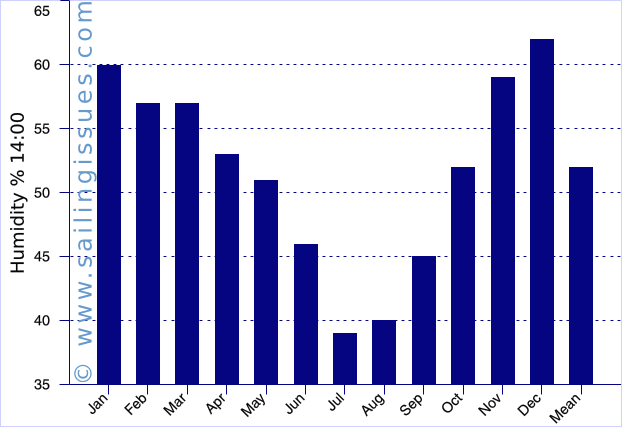
Humidity 14:00
Read more articles in my yachting guide.
Yachting guide
- Charter guide
- Assisted bareboats
- Bareboat requirements
- Choosing a charter yacht
- Catamarans & monohulls
- Prevent seasickness
- Greek sailing areas
- When to sail in Greece
- Yacht charter provisioning
- Itineraries Ionian
- Itineraries Argo-Saronic
- Itineraries Cyclades
- Itineraries Dodecanese
- One-way itineraries
- Flights & ferries
- Last minutes & budget
- Sailing between Greece & Turkey
- Greek chart terms
- Greek fishing techniques
- Climate graphs Athens
- Climate graphs Bodrum
- Distances sailing Greece
- Itineraries Ionian + Aegean