Coastal
NAVIGATION
Nautical Charts
The nautical chart is an image of a part of the earth in two dimensions. This reproduction is a two dimensional image of a part of the earth, which is of course 3 dimensional. This results in various distortions, but as long as two requirements are met we can use this image for navigational purposes. Firstly, the angles between three object in the chart should be the same as the angles between the real objects which they represent. Secondly, a straight course should appear as a straight line in the chart.
To fulfill these demands our chart ought to have both parallels & meridians which are straight and parallel. As such the meridians & parallels will be perpendicular to each other.
A well known method to create such a chart is called the Mercator Projection after Gerard Kremer (Mercator), a Flamish scolar who studied in 's Hertogenbosch and Leuven. In 1569 he invented the projection which made him famous. His chart was designed for sailors and constructed by wrapping a cylinder around the planet so that it touches the equator. On this cylinder the surface of the earth is projected and finally the cylinder is cut open to yield our chart. But where the meridians converge on the globe they run parallel in the projection (see chart below), indicating the distortion. Look, for example, at a high parallel. The length of such a parallel on the globe is much smaller than the equator. Yet, on the chart they have exactly the same length creating a distortion which gets bigger nearer to the poles. The figure below shows us the construction of the mercator projection. From this it is clear that only the vertical scales should be used for measuring distances.
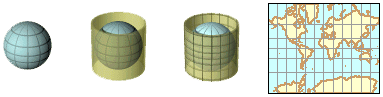
The vertical scale depicted on the right demonstrates the distortion. While the two little gray markers have the same size, the upper one measures only 0.71 degrees. So, distances (in miles or in minutes) should not only be read on the vertical scale, but also at approximately the same height. 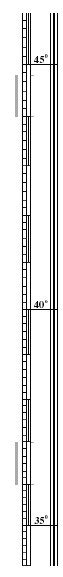 The horizontal scale is only valid for one latitude in the chart and can therefore only be used for the coordinates (a point, but not a line). If you divide the surface of the earth in eight pieces, and lift one out and project it, you end up with the figure below.
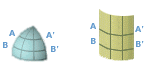 The result is that both A-A' and B-B' are now as long as the bottom of the chart and are 'too long'.
But there are of course other projections in use by sailors. An important one is the Stereographic projection which is constructed by projecting on a flat plane instead of a cylinder. On this chart parallels appear as slightly curved and also the meridians converge at high latitudes. So, strictly speaking, a straight course will not appear as a straight line in the chart, but the parallels remain perpendicular to the meridians. Most often, distortions are scarcely noticed when this projection is used to chart a small area. Like the mercator projection, the vertical scale represents a meridian and should be used for measuring distances.
Another projection is the Gnomeric projection on which the meridians are again converging. But most importantly, the parallels are arcs of a circle while great circles appear as straight lines. On a sphere the shortest route between A and B is not a straight line but an arc (part of a great circle). Though this is also true when you -for example- cross a little bay, we use for simplification a Loxodrome (a handy straight line on your mercator chart which does not reflect your shortest route). On a Gnomeric chart this same loxodrome is an arc, while your shortest route (a great circle) ends up as a straight line.
Hence, the gnomeric projection is particularly useful when sailing great circles (like when you dabble in circumnavigation) and is clearly beyond the scope of a coastal navigation course.
Organization of the Chart
- Authority: The publisher responsible for the information in the chart. "British Admirality Charts" or "Imray Charts". Check their corrections.
- Title: The Title gives a description of the area covered by the chart. For example: " The Mediterranean Sea".
- Number: Different chart types of the same area can be distinguished by the chart's number.
- Projection: Most likely the Mercator projection as described above. Charts covering small areas can be constructed by stereographic projection.
- Scale: For example: 1:193000. But since the chart is distorted this holds only for one specific latitude in the chart. The scale gives an indication of how detailed the chart is.
- Horizontal Geodetic Datum: The definition of the relationship between the ellipsoid adopted as the model of the Earth's shape, and the Earth itself. Though there are hundreds of datums in use, most are only locally valid.
The WGS-84 datum is global in scope and positions obtained by satellite navigation systems are usually referred to this datum. Therefore a correction needs to be applied to a WGS-84 GPS position to agree with charts using other horizontal datums. For example to correct WGS-84 to the Europeam datum, add 0.06'N, 0.04'E to the WGS-84 position indicated by the GPS. Fortunately, most GPS recievers may be set to display positions in several other datums besides WGS-84. - Chart Sounding Datum: The tidal datum to which soundings and drying heights on a chart are referred. Often shortened to 'chart datum' when it is clear that reference is not being made to a horizontal datum. Chart Sounding Datums are also used as reference for heights (lighthouses, mountains, bridges). Multiple datums can be used in one chart: L.A.T. for soundings and M.L. for heights.
- Soundings & Height Units: Soundings and Heights can be stated in -for example- meters, feet or fathoms. Nowadays even most British charts use the metric system.
- Horizontal Scale: Natural scale at for example 40° 15',0 latitude where the horizontal scale can be used for measuring distances and were the chart scale is true.
- GPS compatability: Most charts neither have the precision nor the resolution to fully use the (differential) GPS positioning potential. Moreover, still plenty of charts result from surveys done in the 19th century.
Also, GPS data often requires a correction for a local horizontal chart datum before it can be used in the chart. - Corrections & Edition: The chart is for example an 1996 edition but is - when properly corrected - still valid in 2000. Corrections are published several times and should be mentioned in the bottom left corner of the chart.
Information in the Chart
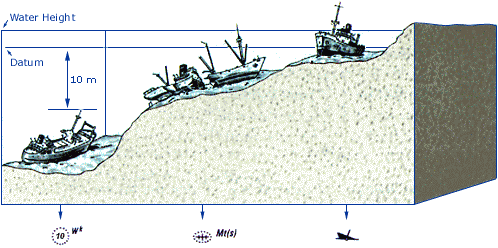
- Depths reduced to Chart Datum: A sounding like (35) indicates 3,5 meters of water above Lowest Astronomical Tide (if the unit is 'meters' and the chart datum is 'L.A.T.'). An underlined sounding like (04) indicates a height of 40 cm at L.A.T. which has fallen dry.
- Isobaths: Lines connecting positions with the same depth: depth contours.
- Heights reduced to Chart Datum: Heights of for instance, lighthouses, mountains and cliffs are more often reduced to another datum such as Mean High Water (M.H.W.) or Mean High Water Spring.
- Tidal information: Details of both the horizontal and the vertical movement of the water is often in included in the chart.
- Buoys & Marks: Lightships, lateral and cardinal marks.
- Seabed qualities: Pebbles, seeweed, rocks, wrecks, pipelines.
- Lighthouses: Their height, color, range, and other properties.
- Magnetic Variation: The angle between the true North and the magnetic North varies in place and time. The variation is indicated in the compass card.
- Conspicuous positions on the shore: Churches, Radio masts, mountain tops, etc. These can all be used for navigation and are marked in the chart.
Chart and Coordinates
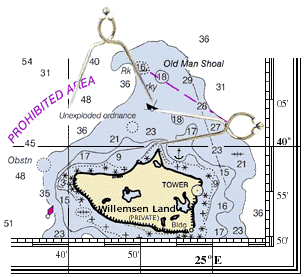
| Visual Wreck | 40° 04',8 N , 24° 52',0 E | |
| Tower | 39° 55',0 N , 24° 58',0 E | |
| Dangerous! Wreck | 39° 52',8 N , 24° 42',2 E | |
| Good Anchorage | 39° 58',5 N , 24° 55',7 E | |
| Buoy with red Light | 39° 52',5 N , 24° 37',2 E |
Chart and Distances
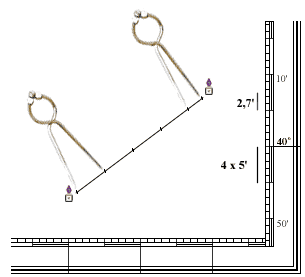
We first take a 'nice' distance like 5' (5 nautical miles) on the vertical scale using the middle latitude. Then we start walking with the dividers from one oil rig to the other. Finally, we adjust the dividers to measure the small remaining part at its own height (its own latitude). Were you to measure it below 40° you would read 2.5' instead of 2.7' !
Chart and Courses
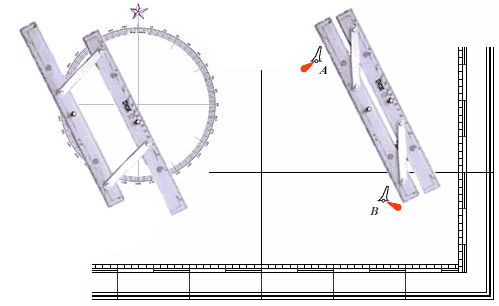
So now we can measure distances and locate coordinates, but we do also need directions. For example we need to find the course from buoy A to buoy B. To accomplish this we may use parallel rules as shown in this chart. First you line this instrument up with the two positions. Then follows the intriguing part in moving the device to the compass rose without losing its alignment. Finally, when one of the rules is aligned with the heart of the compass card, you can read course A-B. In this example: 153°.
Important Symbols
| Super(light)buoy, Lanby. | Light buoy. | |||
| Lateral green starboard hand buoy. | Lateral red port hand buoy. | |||
| Safe water mark (red/white). | Cardinal buoy, West mark. | |||
| Stone; drying height above chart datum. | Foul seabed. Avoid anchoring here. | |||
| Danger, least depth by sounding. | Danger, depth swept by wire drag. | |||
| Wreck visible at chart datum. | Wreck showing Mast(s) above chart datum. | |||
| Dangerous! Wreck, depth unknown. | Wreck, not dangerous (10 m below chart datum). | |||
| Position for which tidal levels are tabulated. | Position for which tidal stream data are tabulated. | |||
| Sector light, color changes on different bearings. | Danger line, in general. | |||
| Oil rig, prohibited zone of 500 m. | Lighted platform, prohibited zone of 500 m. | |||
| Obstn | Obstruction. | Wd | Seaweed, describes seabed. | |
| PA | Position Approximate. | P | Pebbles, the seabed. | |
| St | Stones - Danger. | Whis | Whistle Buoy. | |
| FL 42m 29M | Flashing light, 42 meters above datum, range 29'. | LFl 10s | Long flashing light, period 10 seconds. |
So, now it is clear that you can find in the chart: "cardinal marks", "chart sounding datums" and "lighthouses that longflash at you" . But what does all this mean?
Well, "lights" along with "Lateral and Cardinal Buoys" are dealt with in great detail in the Navigation Aids chapter while the exact meaning of "chart datums" will be explained in the chapter about Tides. For now, just remember that all this information can be found in the nautical chart.
Overview
Mercator projection: Most coastal nautical charts are constructed with this method. Angles are true and distances can be measured using the vertical scale.
Stereographic projection: Used for chart covering small areas. Like the Mercator projection use the vertical scale to measure distances.
Gnomeric projection: Used for vast areas. Great circles appear as straight lines on the chart.
Great circle navigation: The shortest course on earth between two positions is a great circle; for circumnavigating and ocean crossings.
Loxodrome: A line which makes the same angle with all meridians. Theoretically not the shortest route, but a handy straight line on a Mercator chart.
Horizontal Geodetic Datum: Defines the relationship between the ellipsoid adopted as the model of the Earth's shape, and the Earth itself. Coordinates which refer to, for instance, AIA should be corrected before plotting them in a chart based on another horizontal datum. If your GPS reciever consistently disagrees with known positions by a constant amount and direction,
then check you have set it to display the correct horizontal datum.
Chart Sounding Datum: The tidal datum (fictitious plane) to which soundings, heights, elevations and drying heights on a chart are referred.
Vertical scale: Distances in nautical miles or minutes (') should be measured at the same latitude on the vertical scale.
Corrections: Each chart is liable to corrections which are published by either a national body or the publisher of the nautical chart.