Tides: navigation & currents
Definition and origins of currents
Currents reflect the horizontal movement of water whereas tides, in the strictest sense, only reflect vertical movements. These currents influence the ship's position and are therefore important to understand.
The horizontal movement is primarily caused by the gravitational pull of celestial bodies, see Chapter 6 on the astronomical origins of tidesChapter 6 on the astronomical origins of tides. But also other factors are in play:
- differences in water temperatures caused by heating and cooling due to the Earth's atmosphere
- differences in salinity caused by rain, evaporation and estuaries
- wind induced friction
- the Coriolis force which is a consequence of the Earth's rotation
Oceanic surface currents

Prominent features in the map, see Figure 8.1 of the major oceanic surface currents include the subtropical gyres centered on 30 degrees latitude in each of the major ocean basins.
The Earth's rotation – the source of the Coriolis force as mentioned above – and the change in wind direction with latitude (from the East in the tropics and from the West at mid-latitudes) cause the circulation of the gyres to
be clockwise ↻ in the Northern Hemisphere and counterclockwise ↺ in the Southern Hemisphere.
The well-known Gulf Stream in the Atlantic and its counterpart in the Pacific, the Kuroshio Current, are strong surface currents (e.g. 30 NM wide, 500 m deep, and with a velocity over 4 knots) that carry heat Northward from the tropics.
The deep oceanic currents (not shown) are caused primarily by water density differences and in general return the (now colder) water back towards the tropics.
To predict the behavior of major ocean currents several references are available. The Sailing Directions (also see this list of Planning guides) contain some information on normal locations and strengths of ocean currents.
Nevertheless, the Pilot Charts are by far the best reference for predicting the direction and speed of these currents. On these charts, arrows indicate the direction of the prevailing current; a number printed above the arrow indicates the average speed.
Since this information is based upon historical averages, it won't predict the actual ocean current encountered with 100% accuracy.
Coastal currents
Ocean surface currents need not be considered in coastal areas.
When close to the continental shelf, the horizontal movement of water is defined mainly by two terms:
- tidal stream or tidal current: gravitational
- current: gravitational, rivers, wind
Tidal streams are described by drift / rate and set, in which drift / rate is the speed and set is the direction of the current.
In order to address tidal streams you will need to use tide tables in conjunction with a tidal atlas, or the tidal diamonds found on the nautical chart.
Diamonds: tidal stream data in the chart
![]() Tidal diamonds are symbols on the nautical chart that indicate the direction and speed of tidal streams, consisting of a capital letter inside a rhombus ♢, both magenta coloured. The diamond symbol is placed on the chart for the location where tidal stream data is available, and tabulated elsewhere in the chart.
Tidal diamonds are symbols on the nautical chart that indicate the direction and speed of tidal streams, consisting of a capital letter inside a rhombus ♢, both magenta coloured. The diamond symbol is placed on the chart for the location where tidal stream data is available, and tabulated elsewhere in the chart.
On any particular chart each tidal diamond will have a unique capital letter starting from “ A ” and continuing alphabetically. This in contrasts to the lower case letters in squares used for the vertical movement of tides, see Tidal levels in the chartTidal levels in the chart.
Somewhere on the same chart – generally on land – will be a tidal diamond table such as the one shown below:
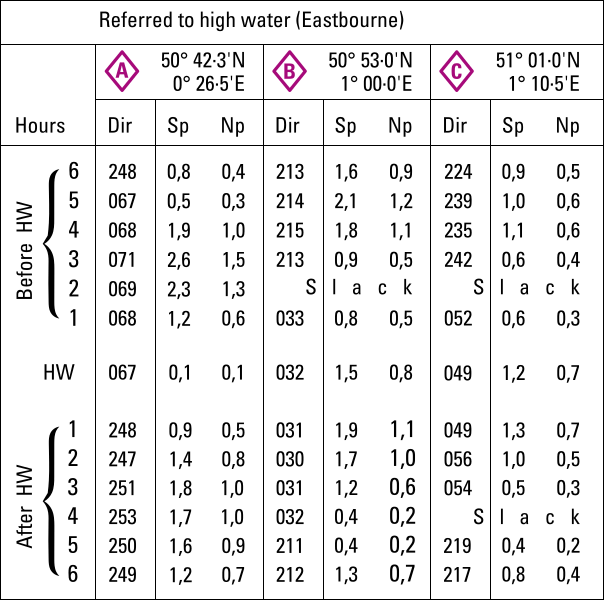
Tidal information in the chart, corresponding to the locations of the diamonds, containing a grid of thirteen rows and three columns for each diamond.
Columns of the diamond table
The three columns show the bearing / set of the tidal stream, and its speed / drift / rate, in knots, at both spring tide and neap tide.
- Dir : Direction of streams (degrees)
- Sp : Rates at spring tides (knots)
- Np : Rates at neap tides (knots)
Note, that “Dir” is direction towards as opposed to wind directions.
Rows of the diamond table
The thirteen rows are the hours of the tidal cycle showing the 6 hours before high water, high water itself and the 6 hours after high water.
The times on the table are related to the moment of high water of the standard port or reference port. In this case Eastbourne harbour in England.
There can be a LW slack water before flooding and there can also be a HW slack water before ebbing: the tidal flow turns and changes direction, indicated by S l a c k.
Conversely, during ebbing and flooding the rates are strongest.
Tidal diamonds give the tidal streams at that location only, a nearby diamond may yield very different sets and rates; sensible interpretation and comparison may be used to estimate the streams at intermediate positions.
An alternative to a tidal diamond is a tidal atlas which are often more accurate and easier to use, yet not always available.
Tidal atlases
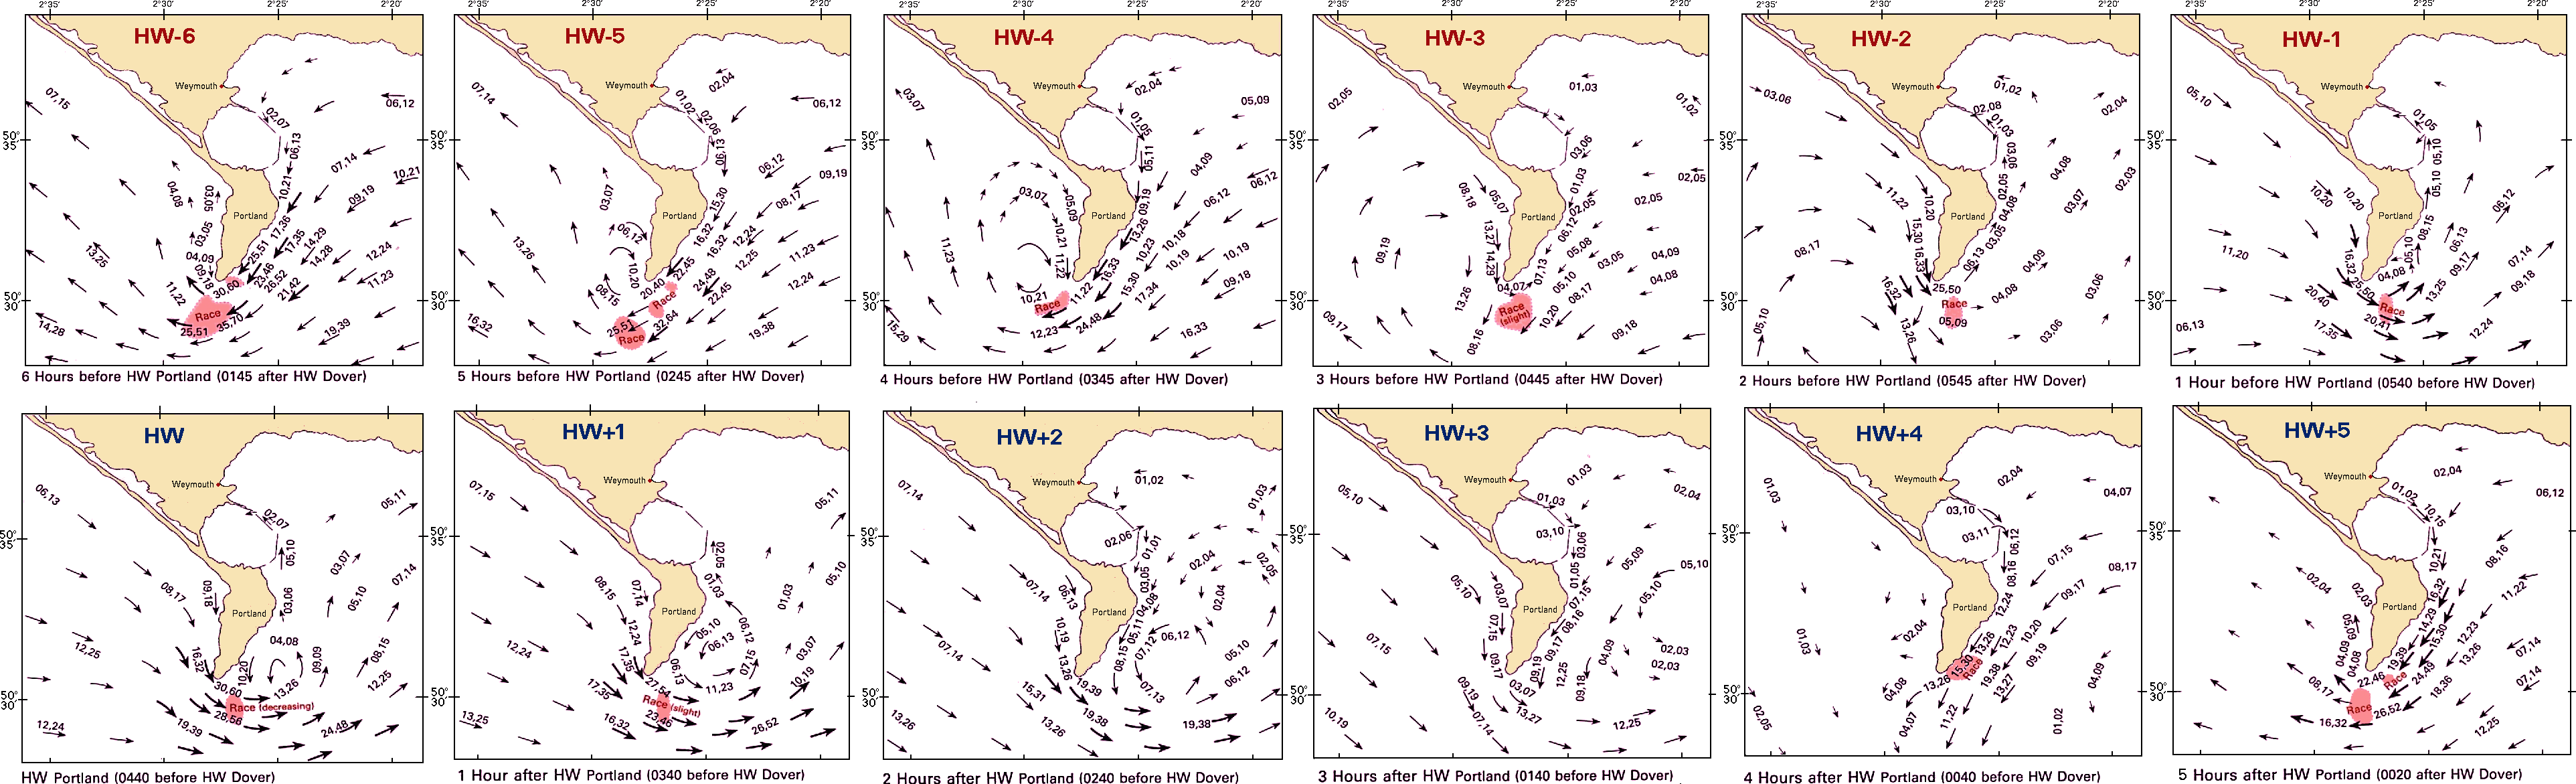
An atlas is a collection of maps or charts, and is named after the Ancient Greek mythological figure Ἄτλας “Bearer (of the Heavens)”, and a tidal atlas presents tidal stream information in the form of 12 or 13 chartlets, one for each hour of the tidal cycle.
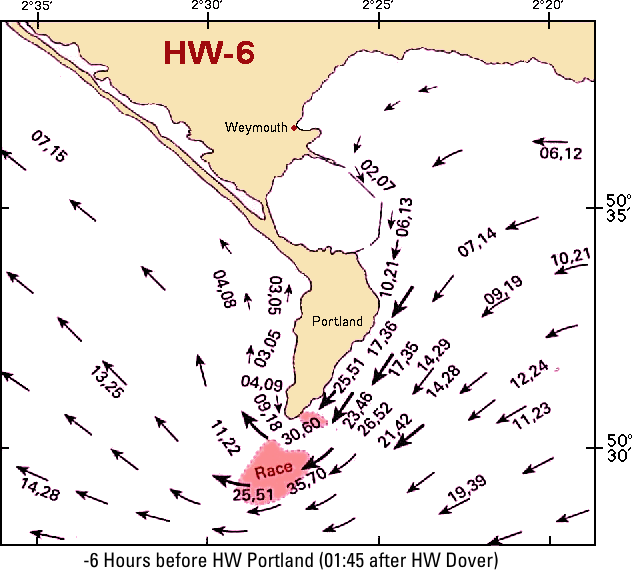
There is a chartlet for each hour of the tidal cycle (i.e. a successive high and low tide).
This chartlet features the tidal streams 6 hours before HW Portland.
The arrows indicate the direction (set) of the tidal stream, and their length and thickness give an impression of its rate.
More accuracy is given by the numbers, arranged in pairs, that show the rate in tenths of knots at neap and spring tides.
For instance 37 , 52 gives a neap tide of 3.7 knots and a spring tide of 5.2 knots. The period (or comma) indicates the geographical position to which the figures refer.
To interpolate for tides that are between neap and spring either the
Rule of sevenRule of seven or an interpolation chart enclosed in the atlas is used.
Furthermore, dangerous areas are shown:
- Larger areas affected by overfalls, races or tide rips are highlighted by colour or contour lines
- Specific positions by

Though several layouts can be used, usually the direction of the tidal stream is shown by arrows, which are heavier where the tidal streams are stronger. Figures against the arrows give the mean neap and spring
drift or rate in tenths of knots.
For example, ![]() indicates a mean neap drift of 2.1 knots and a mean spring drift of 4.6 knots.
indicates a mean neap drift of 2.1 knots and a mean spring drift of 4.6 knots.
A short thin arrow shows a weak tidal stream; a fatter and usually longer one shows a faster one.
Tidal atlases provide not only a graphical version but also show a wider area, and are therefore a very useful addition to the aforementioned tidal stream diamonds.
Where tidal diamonds have the advantage of precision, particularly in terms of direction – which can be difficult to measure on the chartlets of a tidal stream atlas – the latter has the advantage of creating a good overall view of the changing patterns of the tidal streams, especially for positions in between tidal diamonds.
Both types of presentation use relative times with respect to HW at a particular port, instead of clocktime.
Tidal apps are to be used alongside the paper publications as well as the tidal layers of the chart plotter. The online and electronic versions will often allow animations and selecting a specific arrow will usually show set and rate, with the precision of a tidal diamond.
Course to Steer
The Course to Steer process, where you know your present position and required Ground Track.You want to find the Course to Steer to allow for the tide, and stay on the Ground Track.
Tidal streams and sea state
The wave conditions or sea state can be influenced by either tidal streams or winds, or by a combination of winds and tidal streams.
 Overfalls, races or tide rips arise where strong tidal streams are deflected upwards to the sea surface or are broken up into turbulence by obstructions on the sea bed. These localized phenomena result in steep and irregular waves close downtide of the obstruction. Though the severity of the overfalls is affected by certain wind conditions, they originate from the tidal streams and are not created by winds, hence they can be predicted and recurring and are marked on charts as a potential hazard.
Overview
- Flood: When the tide is coming in and filling the bay, fjord, firth or estuary.
- Ebb: When the tide is going out and draining the bay, fjord, firth or estuary.
- Springs: When the Moon and Sun are in alignment to produce the maximum gravitational pull and hence the biggest and fastest tides.
- Neaps: When the Moon and the Sun are at their weakest alignment so the gravitational pull is less and the tides are at their smallest and slowest.
- Range: The height difference between high and low water, which varies every day.
- Eddy: Area of recircling water caused by main tidal stream flowing past a headland.
- Tidal diamonds
 such as the example on the right for location “D”, are shown on nautical charts at locations where tidal stream information has been measured: set (direction) and rate (speed).
This information is included in the same nautical chart and tabulated in a tidal stream table.
such as the example on the right for location “D”, are shown on nautical charts at locations where tidal stream information has been measured: set (direction) and rate (speed).
This information is included in the same nautical chart and tabulated in a tidal stream table. - Tidal stream atlas: These show the tidal currents for each hour of the tidal cycle. These comprise a total of 13 (or 12) tidal charts ranging from 6 hr before HW till 6 hr after HW (high water in a certain standard port). So, these charts are relative to the time of HW and to use them we must know the absolute time of HW.
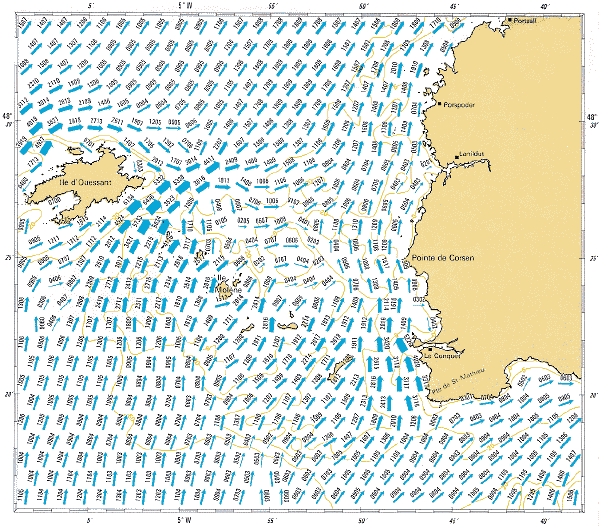
French tidal chart – Ile d'Ouessant (near Brest) 4 hours before high water. - Tidal atlas / stream arrow:
The numbers (for example 11.20) give the average speed of the current at neap and spring tide. In this example, the rate at neap tide is 1.1 knots and at spring tide is 2.0 knots.
- The thicker the arrow, the faster the water it represents is flowing
- Two figures relate to springs (bigger) and neaps (smaller)
- The decimal place is not included: e.g. 40 is not forty but 4.0
- Speeds are given in knots
- Fetch: The distance over open sea which the wind can blow. Bigger fetch = bigger waves and smaller fetch = smaller waves.
- Tide race: Happens when the tidal flow is constricted or squeezed through a horizontal gap. it flows faster.
- Overfall: Where the tide is constricted by the sudden decrease in depth. When the volume of water is sufficient and the speed of water is sufficiently fast this will result in surface turbulence.
See the next chapter…
Also you can download the exercises + answers PDF ![]()